|
We will be using ssa_names.txt in today's lecture and homework assignment.
This week we will begin learning about panel data and using Stata's xtset.
On reshape:
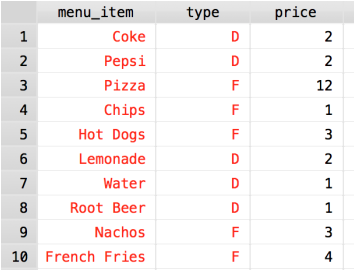
Suppose, I have the following dataset (menu.dta) and I want to reshape it so that I have separate price columns for food and drink. Let's see what the data looks like. For variable "type", D = Drink, F = Food. use menu.dta, clear ed
Since I want to reshape prices such that I have separate columns for food and drink, I tell Stata to reshape my data. We want to go from long to wide using the price variable, I want my rows (i in the reshape command) to be the menu items, and my columns (j in the reshape command) to be the drink/food type. Note that the "type" variable is string, so we have to type -string- in our reshape command.
Therefore I type the following into Stata and I see that I have reshaped the data such that I have variables PriceD and PriceF for the drink and food prices of the menu items. Just what we wanted. reshape wide price, i(menu_item) j(type) string ed
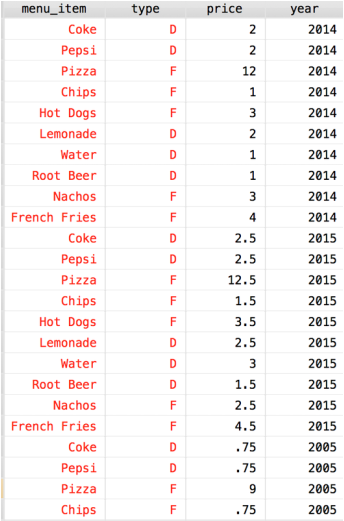
Now suppose that I have menu prices over different years and again I want prices to be different columns. We follow practically the same steps as above.
use menu_by_year.dta, clear
ed
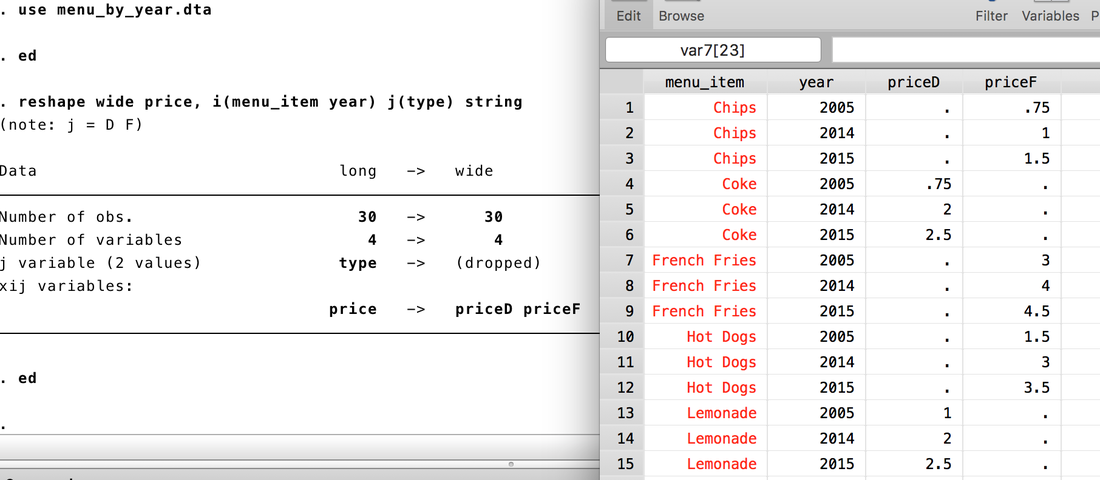
Again we're going from long to wide, but this time we have years in our data. So, we're reshaping our price variables and I want my row variable (i) to be menu items WITH prices. YES, (i) can contain multiple variables, and I want my columns (j) to be the drink/food type. (Again, this is a string variable.)
Therefore I type the following and I see that I have reshaped the menu item such that I have variables PriceD and PriceF for the drink and food prices for the menu items and years. reshape wide price, i(menu_item year) j(type) string
And there you have it. This latter example will be useful in this week's assignment.
Line graphs
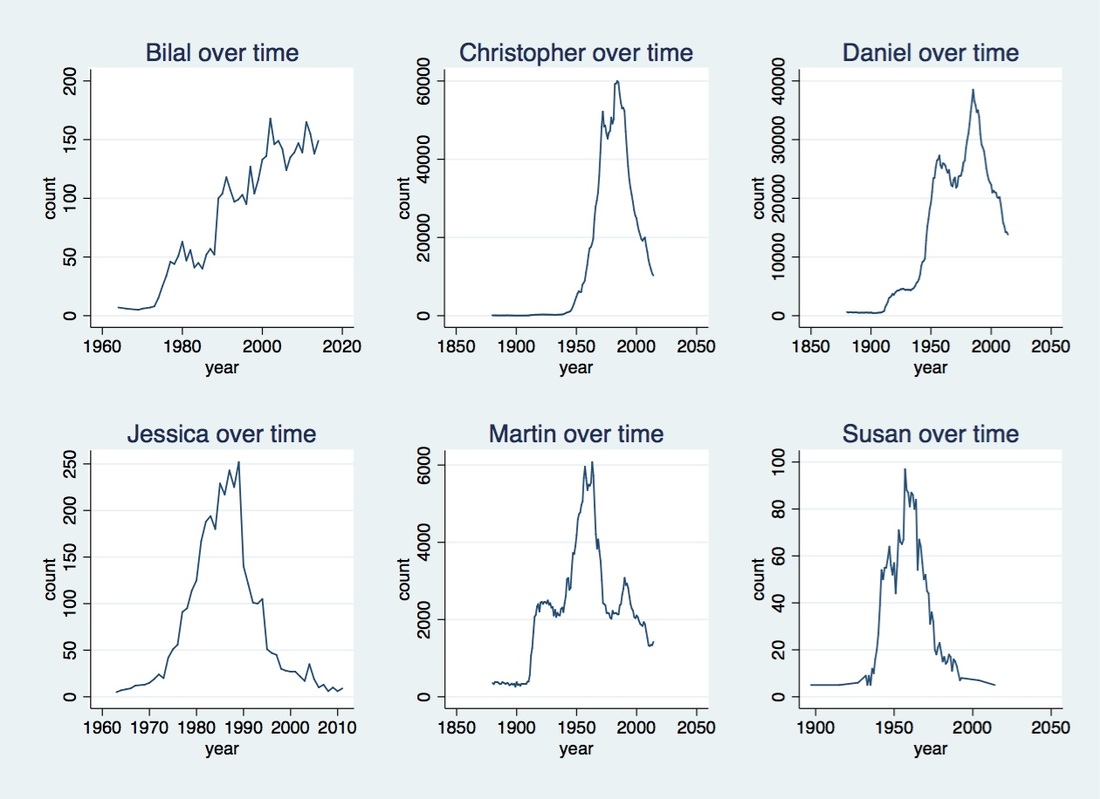
Just for reference here are some line graphs containing the popularity of your names over time:
0 Comments
Leave a Reply. |
|||||||||||||||||||||||||||||||||||||||||||||||||


