Belen Chavez
  • Introduction
  • About
  • Data Blog
  • Calligraphy
  • Teaching

Week 6

2/25/2016

0 Comments

 
This week's topics include spmap and putexcel

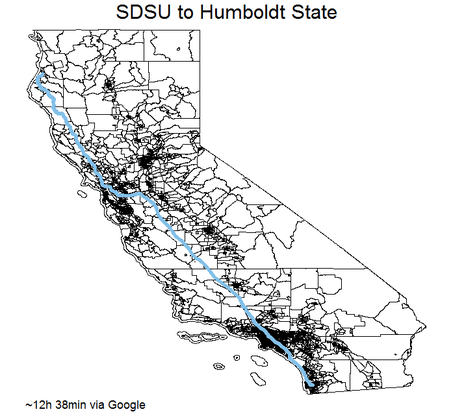
Example using spmap with line option:​

spmap using cacoord, id(_ID) line(data(directions)  ///
    color(eltblue) size(.8)) title("SDSU to Humboldt State")  /// 
    note("~12h 38min via Google")


Picture
directions.dta
File Size: 293 kb
File Type: dta
Download File

spmap_examples.do
File Size: 3 kb
File Type: do
Download File

putexcel_example.do
File Size: 1 kb
File Type: do
Download File

testing.xlsx
File Size: 6 kb
File Type: xlsx
Download File

blank.xlsx
File Size: 2 kb
File Type: xlsx
Download File

0 Comments

Week 6 - Midterm Project - Part 1

2/24/2016

0 Comments

 
You are to create an Excel file through Stata which requires the use of spmap, sh2dta, mqgeocode, and putexcel to combine multiple data sources and summarize findings.  See instructions in midterm_project_part1.pdf below. 
sd_info.xlsx
File Size: 280 kb
File Type: xlsx
Download File

midterm_project_part_1.pdf
File Size: 101 kb
File Type: pdf
Download File


Data: 
  1. ​Use 2014 ACS 5-year estimates using American FactFinder to download data for your assigned county (with census tract information). ACS Data can also be downloaded here
  2. Shape files for California census tracts (Select Layer: census tracts) 
  3. California Brewery Data located below
CA_Breweries.dta
File Size: 67 kb
File Type: dta
Download File


Use ACS FactFinder to double-check your work to ensure you have the correct results. See screenshot below. Top is from FactFinder Community Facts for San Diego County. The bottom is from the table in SD_Info.xlsx. 
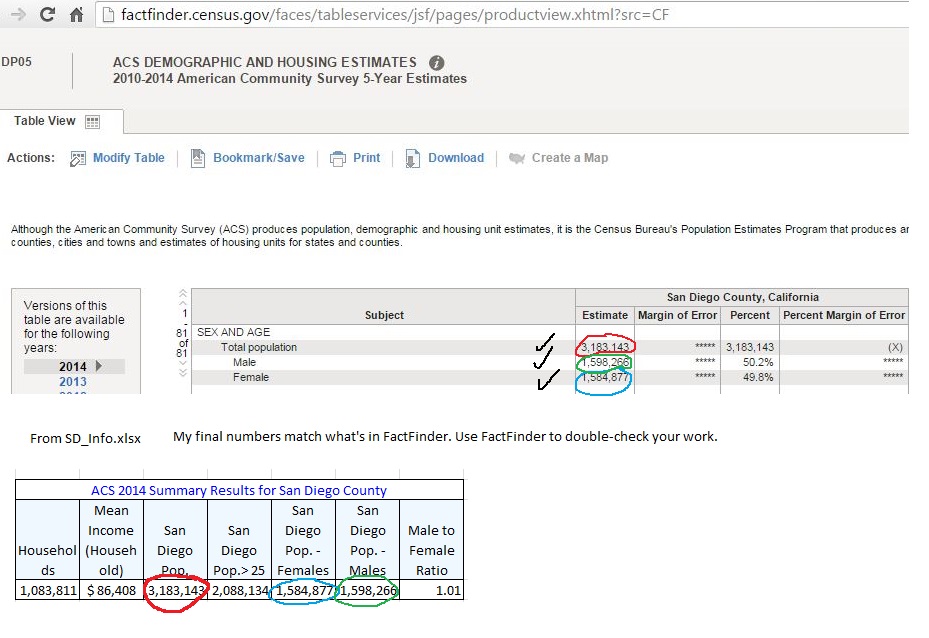
Picture

Helpful Links

  • ​Stata FAQ working with spmap
  • spmap presentation 
  • Multilayered maps
  • Extra: Spatial Data Analysis presentation
  • Stata putexcel 14 help 
0 Comments

Week 5

2/17/2016

0 Comments

 
This week we will be discussing binary response models:
  • Linear Probability Model 
  • Logit
  • Probit 


Helpful links:
  • Predicted Probabilities and Margins after logit/probit in Stata (Princeton) 
  • Getting Started with Logit and Ordered Logit (Princeton)
  • Logistic Regression (Notre Dame)
  • Stata Margins Presentation (Notre Dame) 
  • Multinomial Logit Lecture Notes (Princeton) 
  • Interpreting Multinomial logit coefficients in Stata  (Princeton) 
  • Conditional Logit (Notre Dame) 

Files to download

week05_lecture.do
File Size: 5 kb
File Type: do
Download File

firm.dta
File Size: 17 kb
File Type: dta
Download File

acp.dta
File Size: 158 kb
File Type: dta
Download File

week05 lecture log.txt
File Size: 32 kb
File Type: txt
Download File

firm_13.dta
File Size: 14 kb
File Type: dta
Download File

acp_13.dta
File Size: 153 kb
File Type: dta
Download File

week05_assignment.pdf
File Size: 201 kb
File Type: pdf
Download File

0 Comments

Week 4

2/10/2016

0 Comments

 
Resume Workshop
0 Comments

Week 3

2/3/2016

0 Comments

 
This week we will be continuing covering panel data and xtreg in Stata using the aapredation.dta dataset. 

Helpful links for panel data: 
  • Stata's reference manual on panel data
  • Princeton's presentation on using Stata for panel analysis
  • Presentation on Panel Data in Stata (ppt file) 
week03_lecture.do
File Size: 5 kb
File Type: do
Download File

Week 3 log from lecture
File Size: 52 kb
File Type: txt
Download File

week03_assignment.do
File Size: 2 kb
File Type: do
Download File

0 Comments

    Economics 641L 
    ​Spring 2016

    I will be posting most course material on this page for the Econometrics Lab course at SDSU.

    See Blackboard for assignment submissions.

    Week:

    All
    Week 01
    Week 02
    Week 03
    Week 04
    Week 05
    Week 06
    Week 07
    Week 08
    Week 09
    Week 12

    Monthly Archives:

    April 2016
    March 2016
    February 2016
    January 2016

Powered by Create your own unique website with customizable templates.
  • Introduction
  • About
  • Data Blog
  • Calligraphy
  • Teaching