|
A few days ago, I attended the San Diego Economic Roundtable at the University of San Diego which included a panel of experts discussing the economic outlook for San Diego County. My favorite speakers were Marc Martin, VP of Beer, from Karl Strauss and Navrina Singh, Director Product Management, from Qualcomm. Singh had a lot to say about data, technology, innovation and start ups in San Diego County. Did you know that there are 27 coworking spaces, accelerators, and incubators in San Diego? I sure didn't. Martin's discussion of beer, all the data he showed, along with some cool maps, sparked this blog post which has been a long time coming. In case you don't know, I'm quite the craft beer enthusiast! Allow me to nerd out as two of my favorite things come together: data and craft beer.
Martin's talk focused on the growing number of microbreweries and craft beer data. Here are some cool facts I came away with from his presentation that are worth mentioning again:
On to my blog post: While searching for beer data for this blog post, I stumbled across a gold mine: BreweryDB.com. I got access to their data using API. In the last few days, I've looped through over 750 requests using Stata's shell command and Will's helpful post on Stata & cURL. In the table below I've detailed the number of beers (listed as results) under each style ID in BreweryDB's database. There are a total of 48,841 beers as of January 17, 2016. When filtering for the word "Belgian" in the style name, I got a total of 5,883 beers. Can you guess what my favorite type of beer is? :) I made the table below using Google Charts API table visualization. There are a total of 170 beer style IDs under BreweryDB and I've summed up the number of beers under each style. You can sort by ID, Beer Style or Results by clicking on whichever column title you'd like.
Disclaimer: This product uses the BreweryDB API but is not endorsed or certified by PintLabs.
Seeing as BreweryDB's data is extensive and I'm oh-so excited to share with you some of my findings, I've decided to make a series of blog posts about this. This is why this is part 1. This is only the tip of the iceberg, my friends, and I'm not sure how big of an iceberg I'll be uncovering, but stay tuned for more.
0 Comments
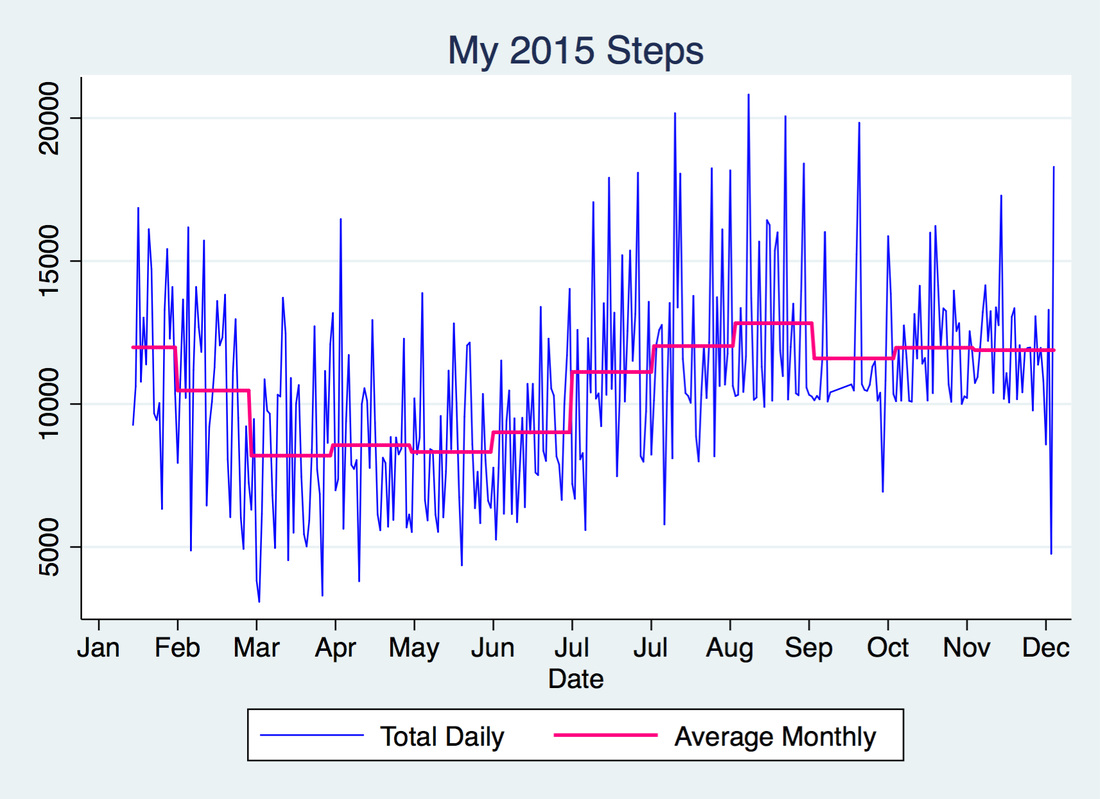
I got my Fitbit on January 15, 2015 and I have been obsessed with it ever since (sorry not sorry, friends and family). I figured that now that 2015 is over, I'd look at my step trends for the year. The graph above shows my total daily steps in blue and my average monthly steps in pink. As you can see, my average daily steps went up after July and remained above 10k throughout the end of the year.
I wasn't meeting goal very often before July and this is evidenced in the graph below. It counts how many times I missed my step goal for every month in 2015: 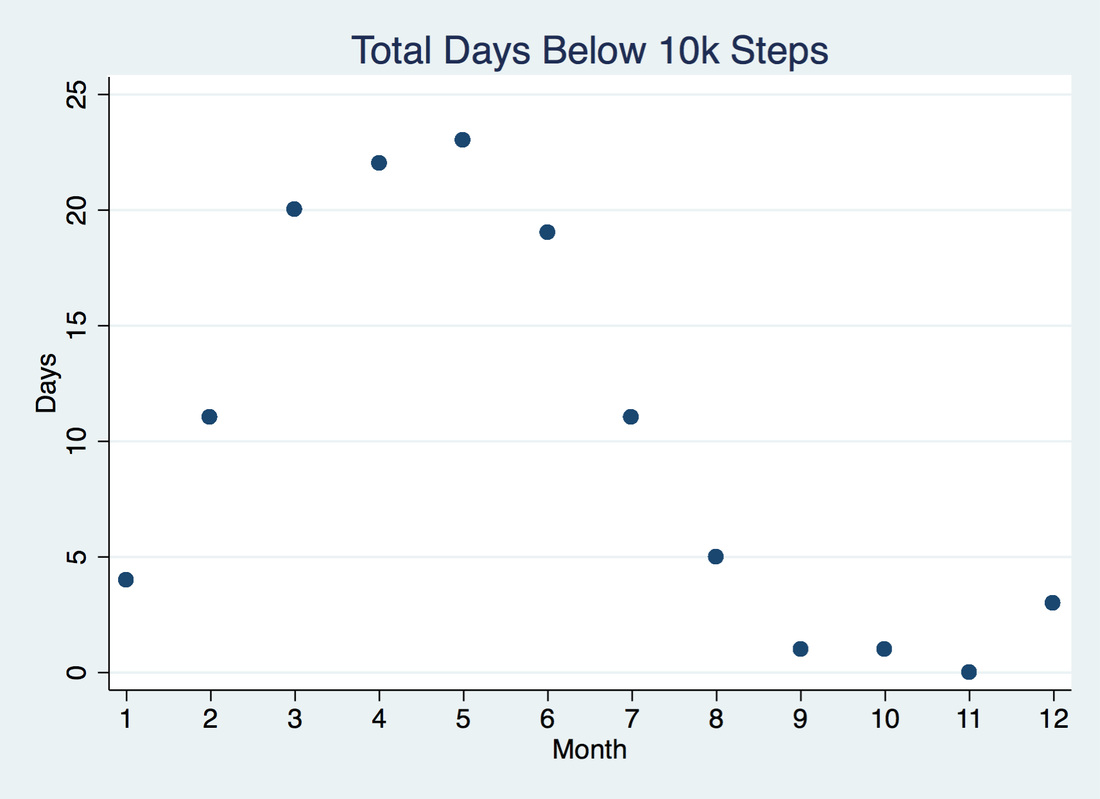
I got better at meeting goal and became more competitive as more people I knew (like Will) got Fitbits and challenged me with Fitbit's Goal Day, Weekend Warrior, Daily Showdown and Workweek Hustle challenges.
Using Stata and Google Charts API I made the following graphic which shows my steps above or below my goal of 10k.
This was motivated by my Fitbit & Google Calendar Chart blog post. The legend is similar:
This includes a total of 344 days. My average daily steps for 2015 was 10,593 steps, and for the months of July through December was 11,910. Also, as the Stata graphs above illustrate, the months of February through June show a lot of days where I missed my step goal. For 2016, I'm aiming to have a lot more blue cells with darker shades of blue. That's my resolution :) Happy New Year! I was on vacation for the last couple weeks of December and the first week of January, so apologies for the lack of updates. Last month, I was hoping to reach above 25k steps and was striving to maintain my 10k step goal streak. Unfortunately, neither of those were realized. To be fair, getting steps in while on vacation is pretty difficult when all venues you go to require driving. Also, the time change really messed up my schedule (it's a 5 hour difference), it was too hot sometimes, and a little dangerous at times in terms of safety. I know, excuses excuses, but I tried! Really! There were times where I walked by myself, went on runs by the beach, and used the treadmill. Who brings running shoes to vacation? This girl, because goals need to be met and Brazilian food is too delicious. Anyway, on to the December update. Below are the total daily steps for Will and me for last month. 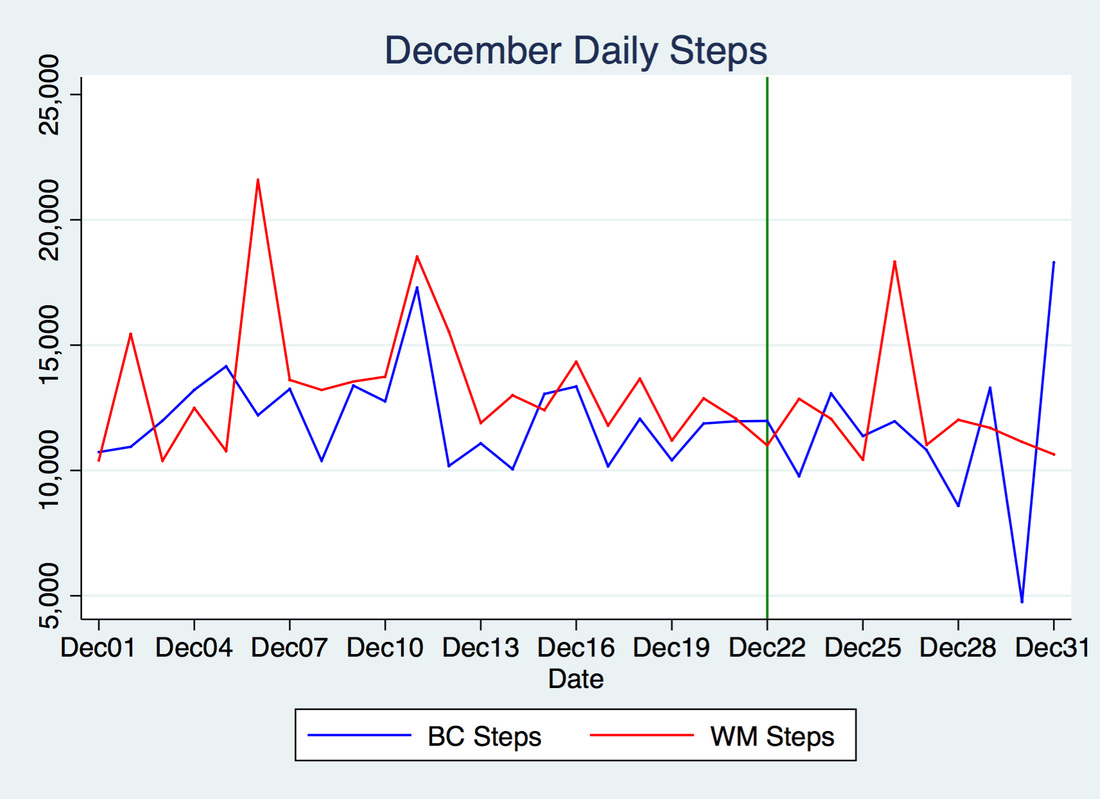 Both of us were out of the office beginning on December 22 which is denoted by the vertical green line. Will's steps are in red and my steps are in blue. As expected, Will met goal every day. Good job, Will! I however, did not meet goal for 3 days last month. Below are my vacation days up through Thursday: 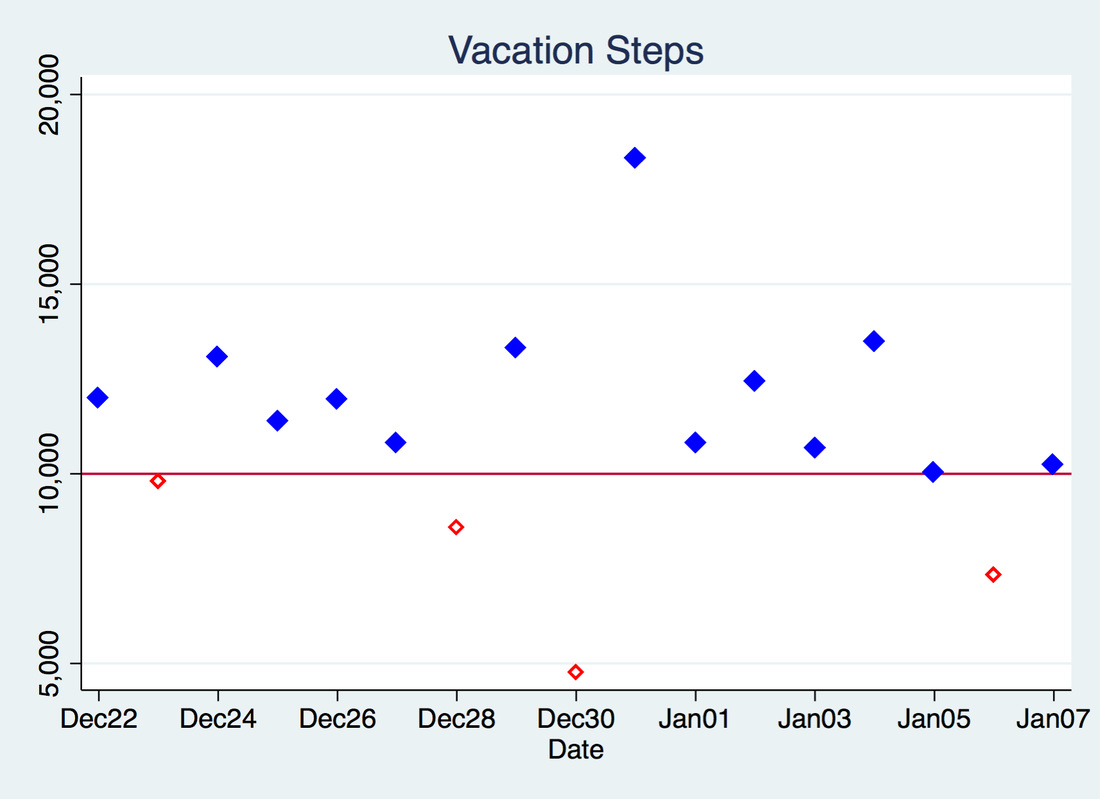 Ok, whoa! Below 5000 steps? I know...Insert extremely embarrassed emoji here. That day, I woke up pretty late around 10 am and went to the beach with my friends up until 4 pm, after which we went to dinner. I later went out with my fiancé and his friends. So no time for walking.
On the 23rd, I arrived in Brazil and due to the time difference I only got 9,773 steps. I was pretty mad about that one. On the 28th I had 1500 steps to go and didn't meet it due to step procrastination (I had 2k steps to go as of 11 PM and figured I'd meet goal during that hour - we went out for a late dinner so sitting was how I spent that last hour). On January 6 I was traveling to the airport and spent most of the day packing, preparing for my trip, and saying good-bye to people, so I only got 7,327 steps. Really bummed about that one because I was hoping for a goal streak in 2016. Womp womp. Anyway, as of today I have 64 days until the San Diego Half Marathon and I am certain step goals will be met due to training. Stay tuned! |
