|
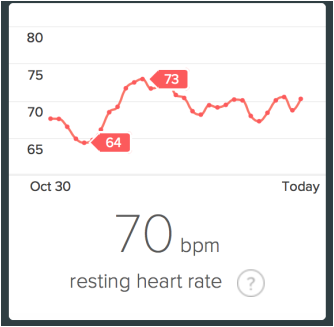
If you have a Fitbit Charge HR, have you ever tried looking at your historical heart rate data through Fitbit's App or Dashboard? Unfortunately, you can only see 30 days worth of data, and that's about it (see picture below). Which I think is weird considering you can see your historical step data from day 1.
If you're curious like me and want to retrieve your historical resting heart rate using Fitbit's API, then this blog post is for you!
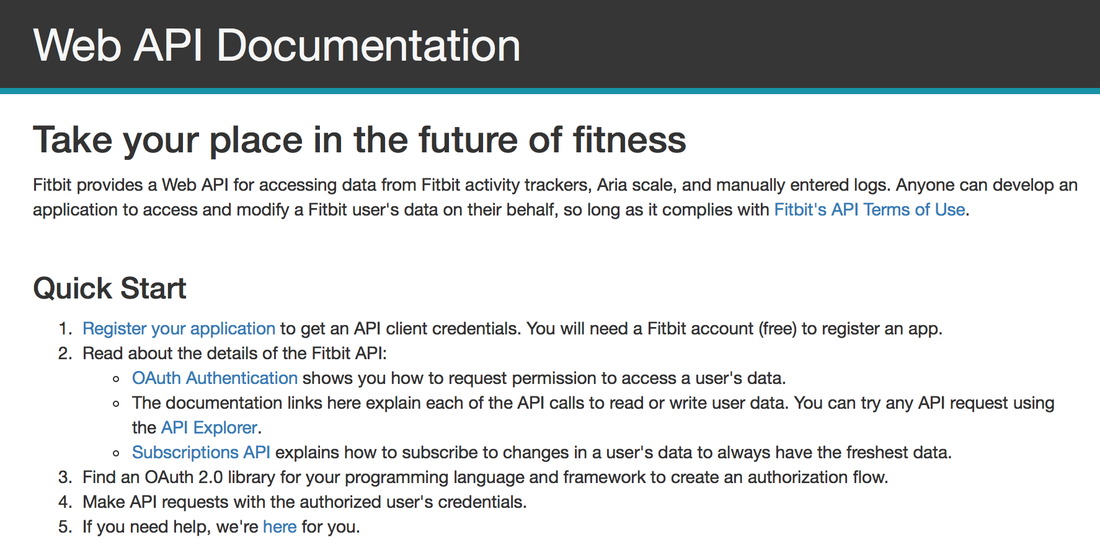
I have a registered app through Fibit Developer API and I use Fitbit's API explorer to download my own data. For steps on using Fitbit's API go to www.dev.fitbit.com/docs. The steps for the API are also below:
Skipping to step 2, I use the Fitbit API Explorer to get my heart rate information by typing the following request URL and replacing the USERNUM with my user number, and replacing the to- and from- dates.
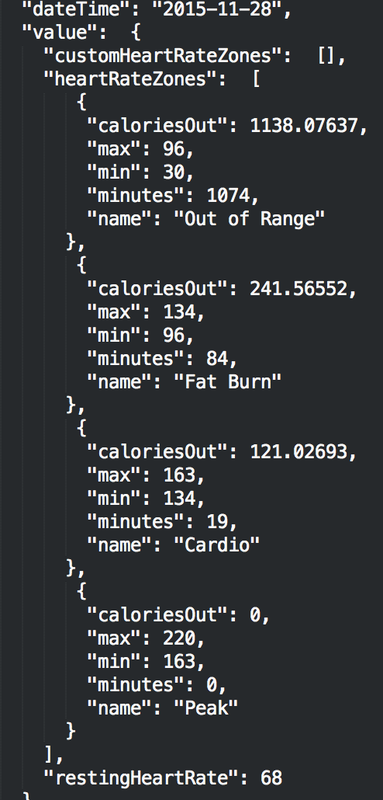
The resulting response is in JSON format which I then parse using Stata. The screenshot below shows the JSON file for yesterday's heart rate information. Unfortunately, the output doesn't contain continuous heart rate information, but it does tell me calories burned in each of the rate zones, as well as the resting heart rate for each day. Just curious, does anyone know where I can get continuous heart rate information?
The file is parsed using the following code, keeping only the date and resting heart rate:
/* Author: Belen Chavez */
/* Parse daily heart data from Fitbit JSON file */

clear
version 12.1
global fname "bc_heart.txt"

forv i = 1/7{
        tempfile f`i'
}

filefilter $fname `f1', f("{") t("")
filefilter `f1' `f2', f("},") t("")
filefilter `f2' `f3', f("[") t("")
filefilter `f3' `f4', f("],") t("")
filefilter `f4' `f5', f(",\n") t(",")
filefilter `f5' `f6', f("}") t("")
filefilter `f6' `f7', f(":") t(",")

insheet using `f7', clear delimit(",")
keep if v1=="dateTime" | v1=="restingHeartRate"
drop v3-v10

gen date = date(v2,"YMD") if v1=="dateTime"
gen resting = v2 if date==.
replace resting = resting[_n+1] if resting==""
keep if date!=.
destring resting, replace
format date %td
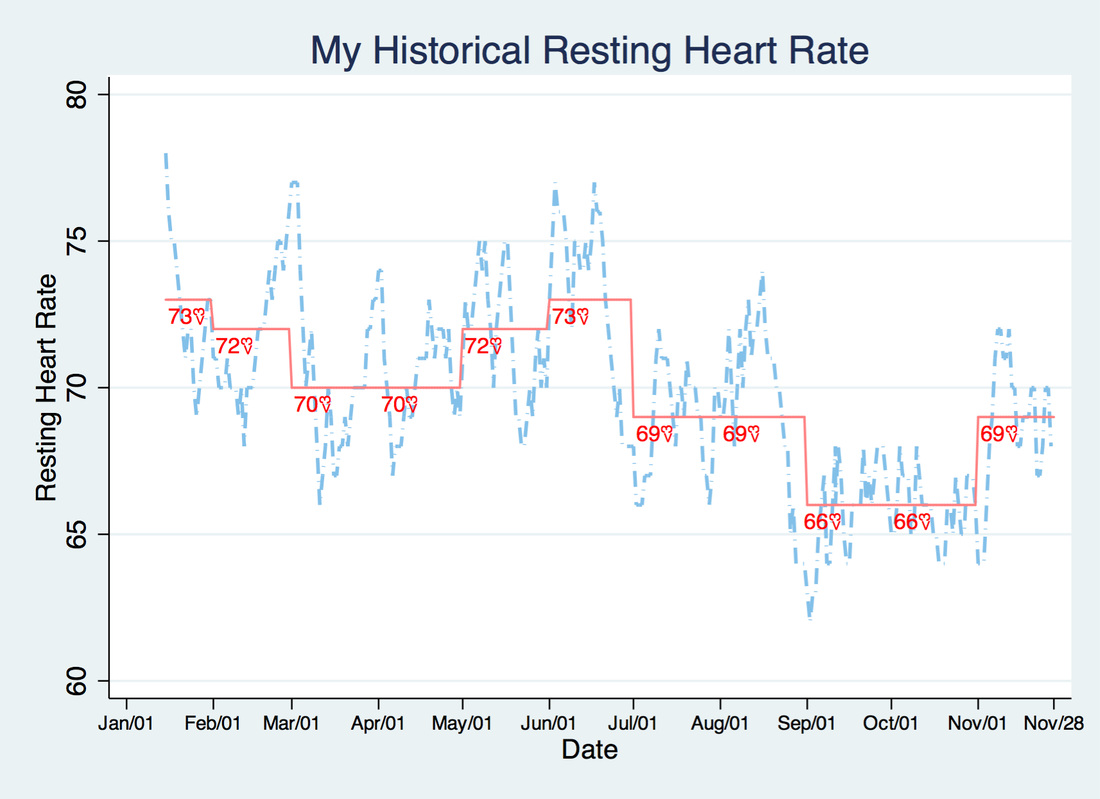
The graph below shows the historical resting heart rate that Fitbit has on me ever since I got my Charge HR:
The dashed line represents my daily resting heart rate (beats per minute), the pink solid line represents my monthly average resting heart rate and the red numbers with the "<3" symbols detail what the monthly average is.
Interestingly, my resting heart rate is quite variable and seems cyclical, with the lowest range in September and October. Does anyone else's heart rate look like this? I read up on this and apparently resting heart rates vary due to medications, illness, fitness levels, and stress. In a few weeks I'll be going on vacation and taking some time off work, I'm expecting my resting heart rate to go down when I'm not at the office, but, we'll see what happens. Also, in a couple of months, I will have had my Charge HR for a year, and I also look forward to looking at the year-on-year change. I'll post more on that in late January or early February! Update April 20- Here's the code I used to make the graph above:
gen ym = mofd(Date)
egen avg_resting = mean(resting), by(ym)
format avg %6.0f
format Date %tdMon/DD
tostring avg_resting, gen(avg_str) usedisplayformat force
gen hearts = "<3"

 * Create a mid-month variable to place the markers
gen midmo = Date if day(Date)==15
 * Create a shifted mid-month variable for the heart markers
gen midmo1 = midmo+4

twoway (line resting Date, ///
        lcolor(eltblue) lpattern(dash_dot) lwidth(medthick)) ///
        (line avg_resting Date, lcolor(red*.40)) ///
        (scatter avg_resting mid,  ///
        msymb(none) mlab(avg_str) mlabcolor(red) mlabposition(6))  ///
        (scatter avg_resting midmo1, ///
        msymb(none) mlab(hearts) mlabcolor(red) mlabposition(6) mlabgap(2) ///
        mlabangle(90) mlabsize(*.75)), xlabel(#12, labsize(*.70)) legend(off)  ///
        title("My Historial Resting Heart Rate")
4 Comments
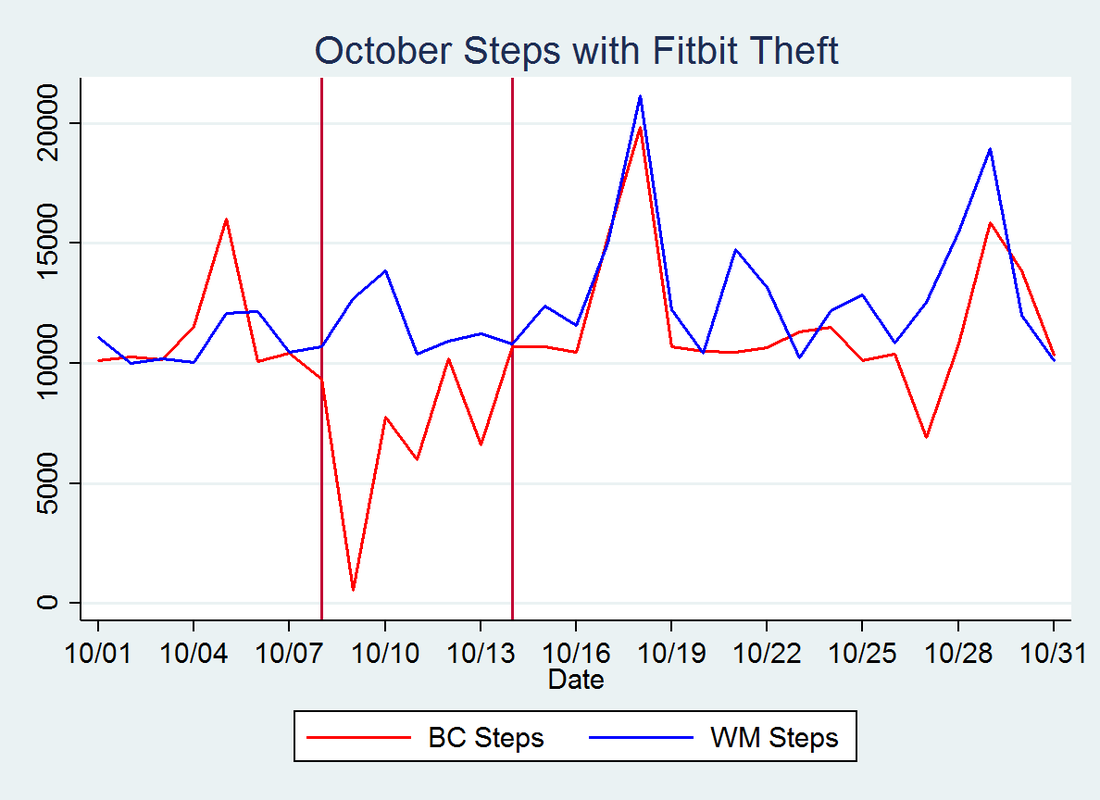
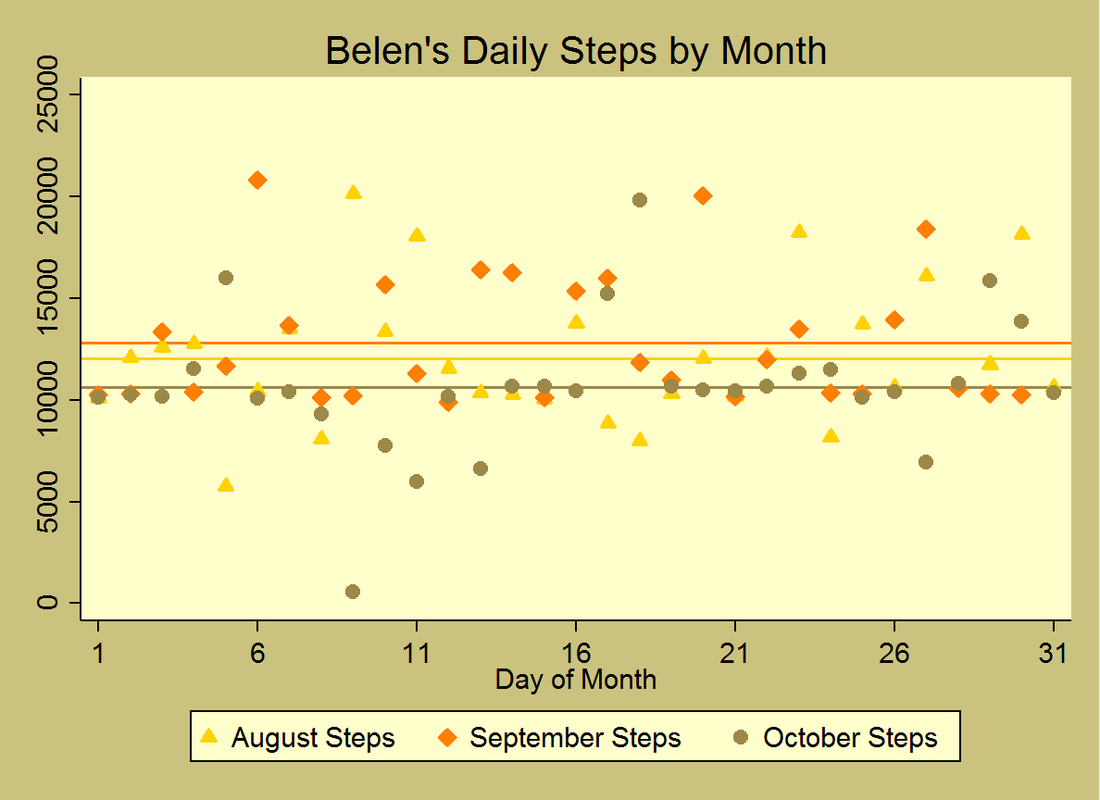
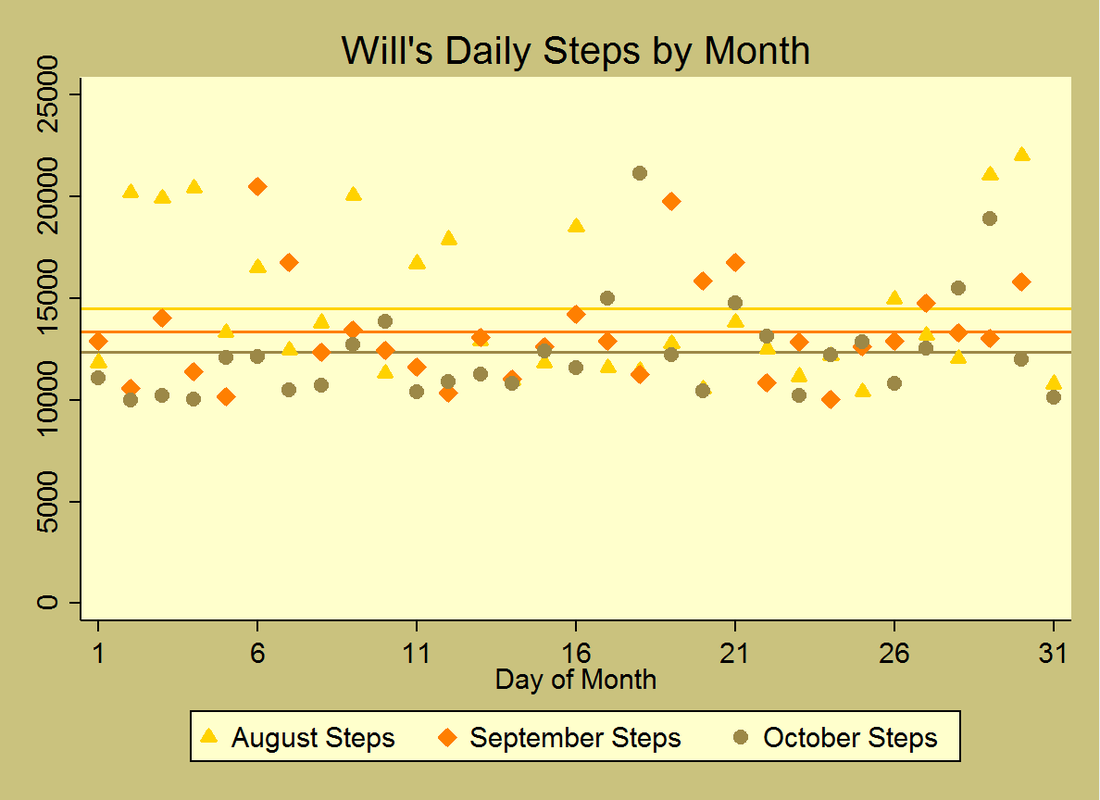
As you recall, I was without my Fitbit for a few days in early October due to someone taking it. I've compared Will's daily steps to my daily steps for the month of October in the graph below: The vertical red lines show the time period that I was without my Fitbit and the few days after where I was told I was being a baby by refusing to wear it (but it smelled like someone else's perfume!). That time span was a total of about 6 days. Interestingly, Will's step count decreased while I was without my Fitbit. After I got it back and started getting back to my usual schedule, both of our step counts increased. My motivation suffered as a result of losing my month-long streak that I had pre-Fitbit theft, and Will's motivation seems to have declined as a result of my lack of motivation, too. Altogether, our steps were less correlated in October than they have been in any other month even after accounting for the theft time period. Having experienced this drop in steps, I wanted to see what our step counts have looked like in the last few months. See Thanksgiving-theme step graphs below. The colors go from yellow to brown to reflect changing leave colors in Autumn. The scatter points are our total daily steps and the horizontal lines reflect the monthly averages. As you can see, our step counts have decreased in the last few months. While my step count increased slightly in September, October's step count was lower than both August's and September's step counts. Will's step count decreased monthly from August to October. His total step count decreased by 10.9% from August to September, and decreased 4.5% from September to October. I've kept track of my November steps and made it a point to not go below my goal of 10,00 steps a day! Stay turned for November's Fitbit update coming in the next week or so.
I am an avid Google user. I think (most) of their products are great. I love Google Maps, Calendar, Drive, etc. I used to share my location through Google Latitude. With Latitude, you could ping your friends and they could share their location with you. That product has been retired for a couple of years now, but thanks to that and never turning off my GPS sharing to Google on my smart phone, I have an extensive record of my location through Google.
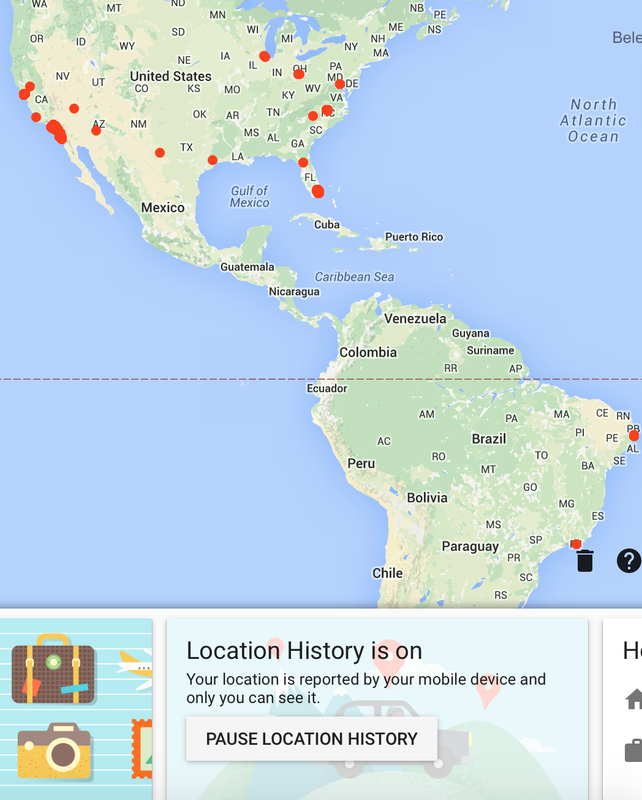
I don't know why I never turned it off (curiosity, perhaps), but in case you don't know, Google Location History can be turned on/off depending on your preferences (see screenshot above). If you use Google and are signed in, the link to your location history (timeline) is here: https://www.google.com/maps/timeline I am not quite sure what Google is doing with my location data, but I do like how accessible/transparent it is to download my own data. My friend tried downloading his location data from Apple and was unsuccessful. I also like the fact that I could tell Google to stop collecting location data or I could even erase my location history (see screenshot below). To be honest though, I'm not sure if they'd keep a copy of it on their end (would they delete my historical data permanently?) Being the data fan that I am, I opt for both parties having the location data. Not sure why, but I trust you, Google.
On to the data post: On November 5th, I decided to download a copy of all my location data. The location history came in a zipped JSON file with about 7.3 million rows which included data on latitude, longitude, time, accuracy, velocity, heading, altitude, and vertical accuracy. I'm not sure what those last 5 variables are, so I ignored them. I parsed the JSON file using Stata and kept one latitude and longitude set per timestamp, leaving me with 765,250 rows of data. The earliest observation is from December of 2010! That's almost 5 years worth of data.
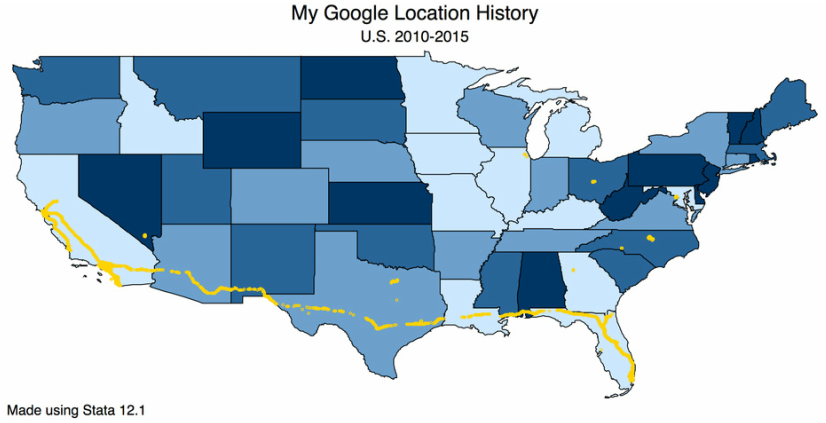
I mapped my Google location points that were within the contiguous United States using Stata below. As expected, it looks very similar to the map above that Google gives me in my timeline, and includes points where I'm traveling. As you can see, I drove from Florida to California once, and many times to/from Southern California and Northern California. What interests me most is to see the time stamps that go along with all the location data. From this data, one could deduce:
You get the picture. With all this, Google can make suggestions and say:
Well, it never did tell me the last one, but the first two suggestions were definitely made. If Google were to create or purchase an activity tracker such as Fitbit, it would certainly know when you're sleeping (given that you have a Charge HR). How well you sleep. When you take a walk or a run, do you take your phone? I mean, the possibilities are endless. Google would know absolutely everything. Email: what you write/what you buy. Search Engine: What you search for/what you think/talk about. Calendar: what you do. Maps: where you're at. Fitness tracker: how active you are. Downloading my location history was a blast to the past and I plan on seeing what else I uncover. I'll keep you posted on any additional discoveries I have on my own data. I've included the Stata code I used below:
/**************************************************************************
Author: Belen Chavez
Purpose: Parse JSON file and clean Google Location data
***************************************************************************/
clear
version 14.1
cd "c:\users\bchavez\desktop"

global fname LocationHistory.json

tempfile f1 f2 f3
filefilter $fname `f1', f("}, {") t("\n")
filefilter `f1' `f2', f(",\n") t(",")
filefilter `f2' `f3', f(\n\n) t(\n)

import delimited `f3', delimiter(",")
drop in 1/2
forv i = 1/8{
        replace v`i' = trim(v`i')
}
drop if v1==""
keep if  regexm(v1,"timestamp")==1
keep if  regexm(v2,"lat")
assert regexm(v3,"lon")
drop v4-v8

forv i = 1/3{
        replace v`i' = subinstr(v`i', `"""', "", .)
        local name = substr(v`i', 1, strpos(v`i', " :")-1)
        cap ren v`i' `name'
        replace `name' = subinstr(`name', "`name' :","",.)
}
destring *, replace
replace latit = latit/10000000
replace longi = longi/10000000
replace times = (clock("1970", "Y")-clock("1960", "Y"))+times-8*60*60*1000
format times %tc
|
AuthorMy name is Belen, I like to play with data using Stata during work hours and in my free time. I like blogging about my Fitbit, Stata, and random musings. Archives
March 2018
Categories
All
|
