|
Hello and Happy New Year, blog readers! I hope everyone's having a great 2018 so far. This month will mark the third year that I've had a Fitbit and you know what that means, right? I now have 3 years-worth of Fitbit data!
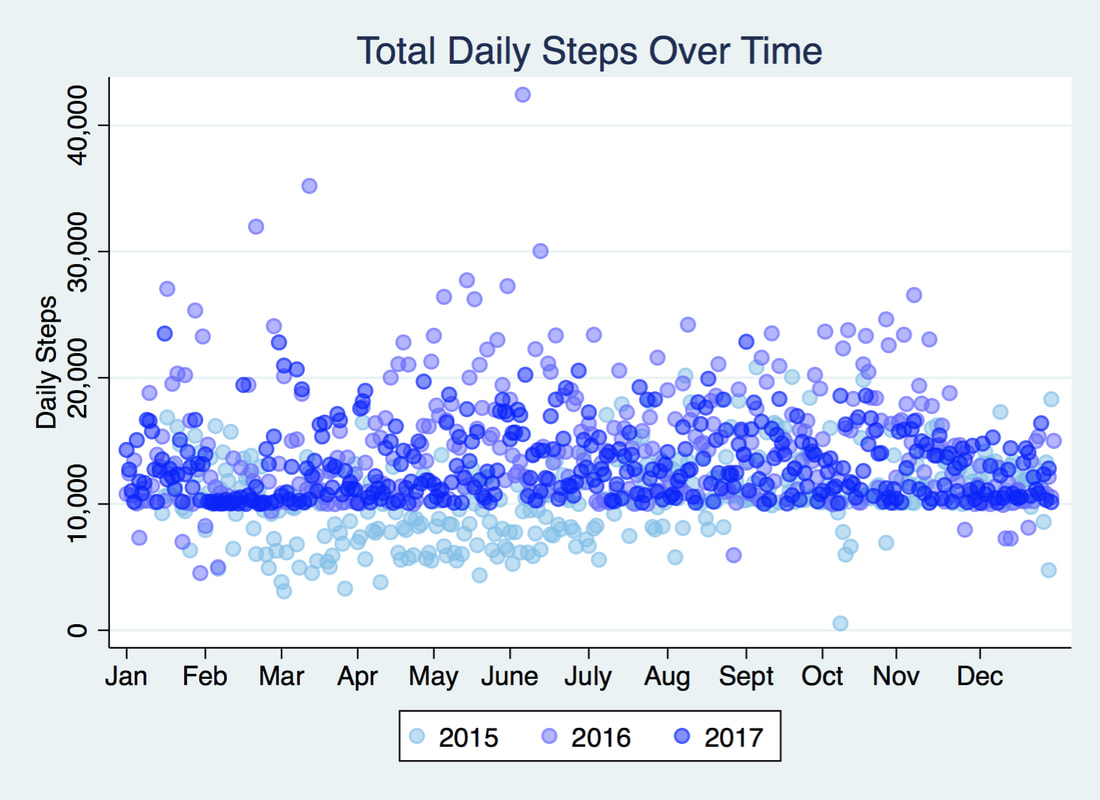
2017 was the first year where I met my step goal of 10,000 steps every single day. In fact, it's now been a solid 380 days since I last missed my goal. I intend on keeping this streak up in 2018. It should be noted that I participated in a Workweek Challenge with my Fitbit friends pretty much every week in 2017 which helped keep me accountable. Using Stata 15's newest graph transparency feature to plot my steps over the last 3 years you can see 2017 steps are consistently above 10k, though they're not as high as 2016's steps (as you'll recall, I trained for and ran 2 half marathons that year).
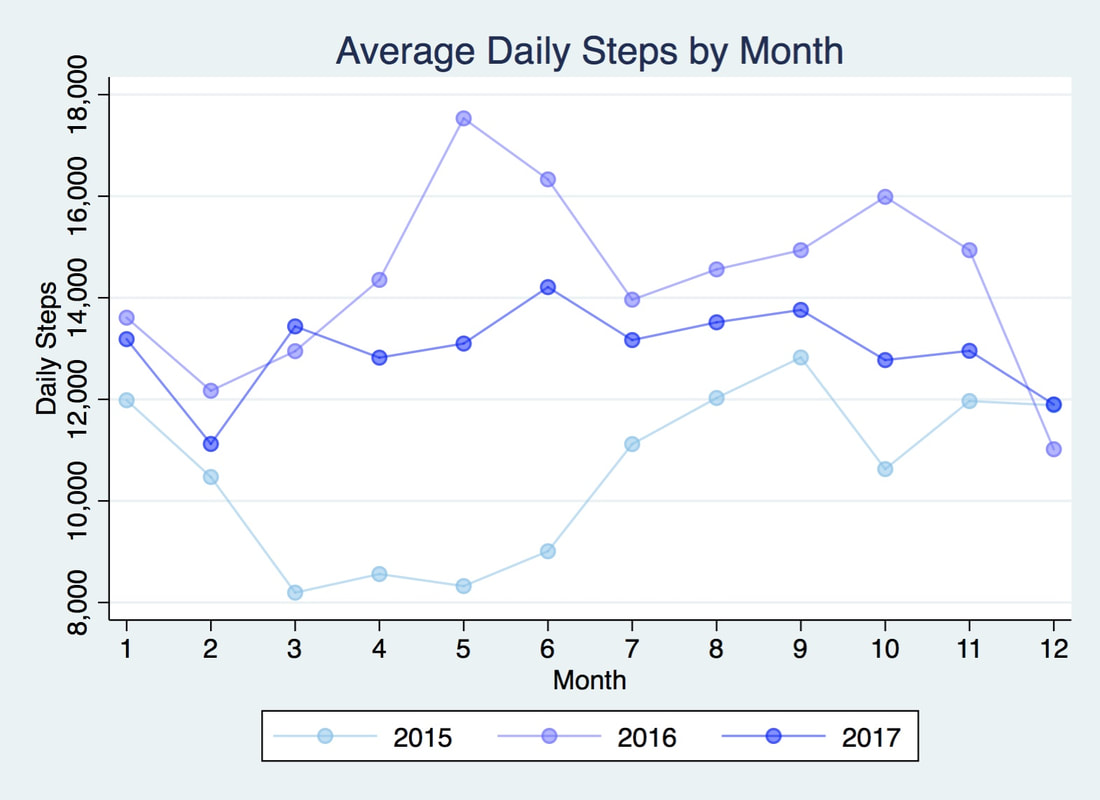
My steps in 2017 were fairly consistent with a range of 11k-14k average daily steps on a monthly basis. The chart below shows the average daily steps I took by month for each year that I've had my Fitbit:
Note that I don't have a full calendar year's worth of data for 2015 as my Fitbit arrived mid-January and it was stolen for a few days in October that year. Keeping that in mind here are the annual stats for each year that I've had my Fitbit:
Total steps taken: 2015: 3,695,222 2016: 5,257,825 2017: 4,747,316 Average steps taken per day: 2015: 10,528 2016: 14,366 2017: 13,006 My daily step maximum per year: 2015: 20,825 which happened on Sept. 6 2016: 42,431 which happened on June 5 2017: 23,503 which happened on Jan. 16 Number of days I missed my 10k daily step goal: 2015: 125 2016: 16 2017: 0 Using Google Charts, I've plotted the data below on a Calendar chart:
In the first 4 days of 2018 I've averaged 13,290 steps per day. It's also worth noting that I'm currently winning my Workweek Hustle as you can see in the small snippet below.
Cheers to 2018 and I hope this year's step counts are even better than last year's!
0 Comments
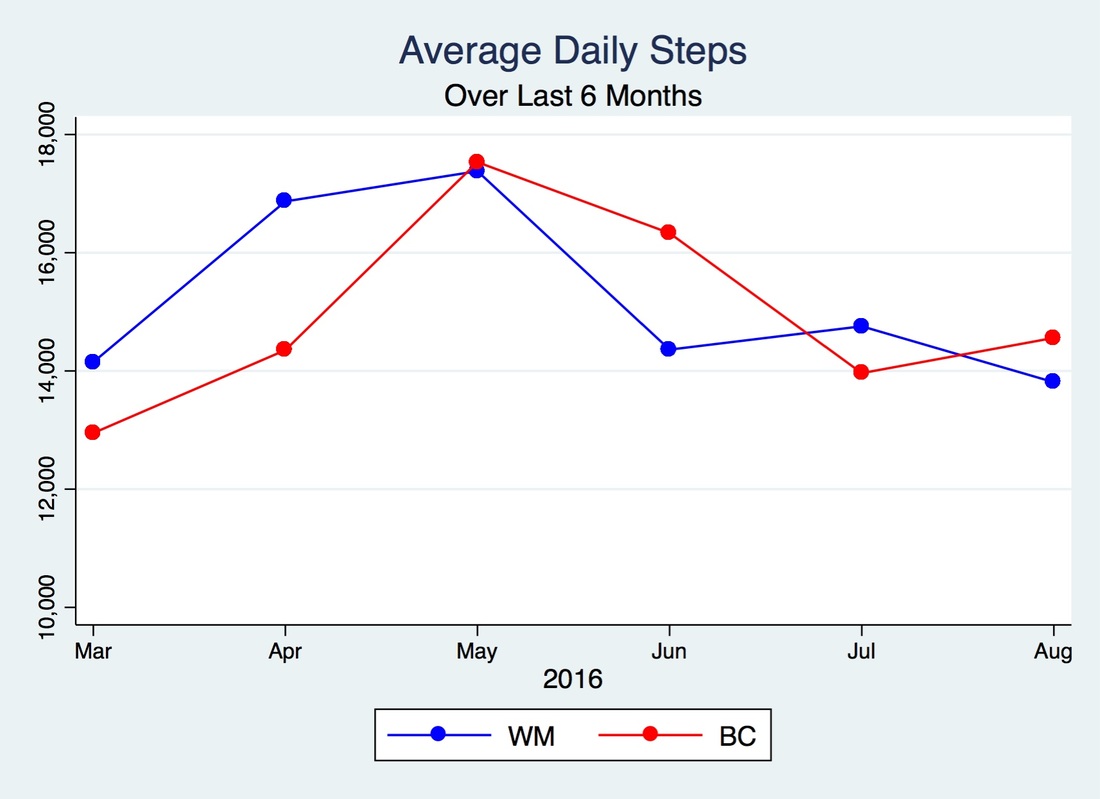
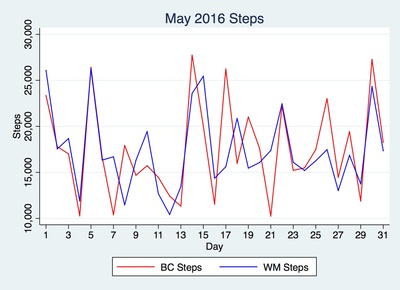
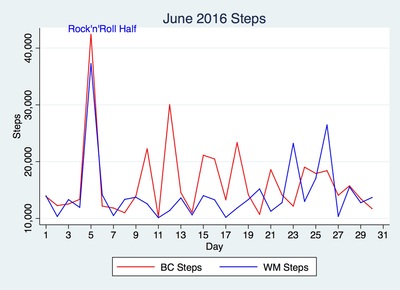
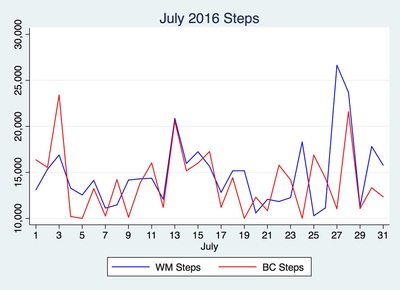
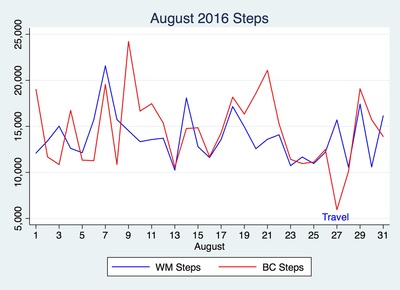
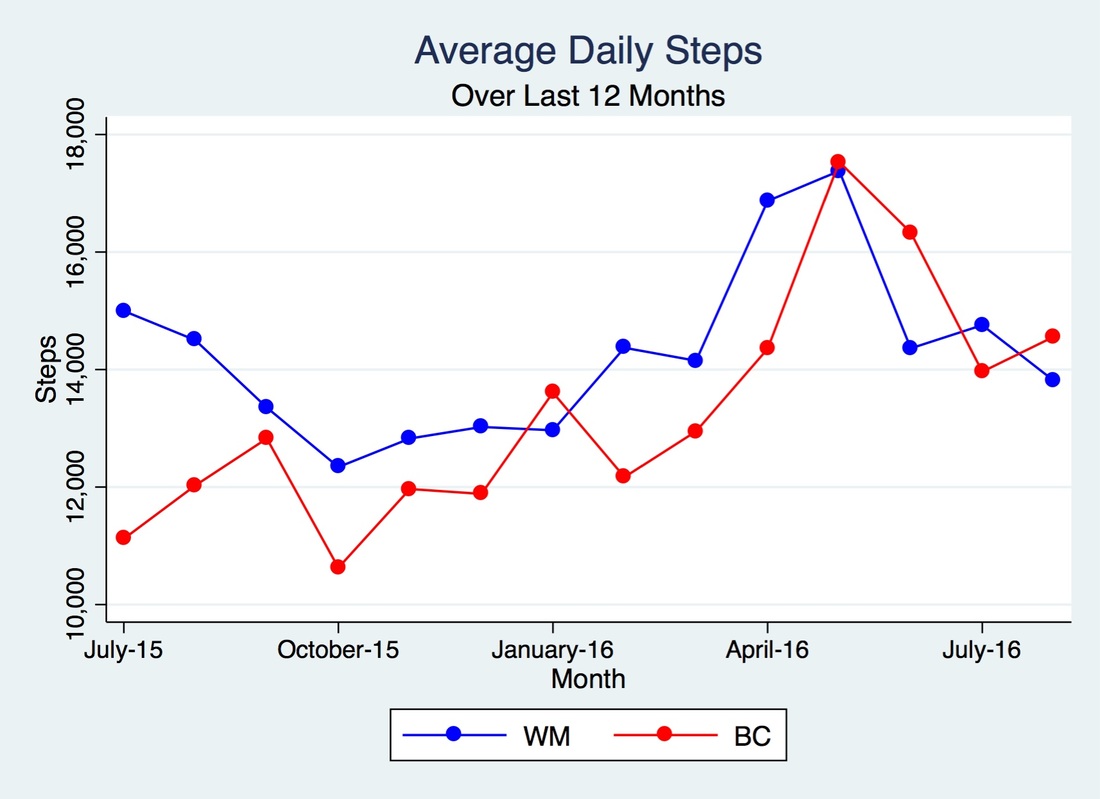
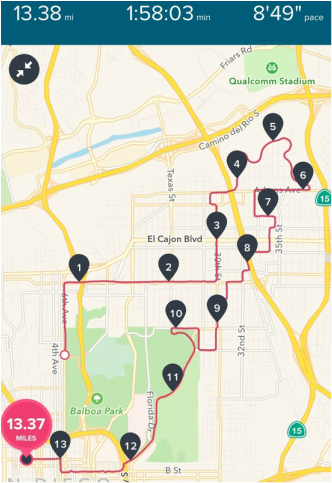
Hello, again blog readers! It's been about 60 days since my last post and it's about time I did another Fitbit step comparison - the last one I did was in April. Yikes. Before I jump into that, let me take a minute to answer some questions you might have: What's new? Well, since I last blogged, a few things have happened. Like I went to Chicago to present at the Stata Conference and that was pretty awesome. I've never presented at a professional conference and our work was very well received. I got to visit San Diego a few weeks ago and that was very nice. We got to see old friends and hang out with family. I loved going back home. The beach was perfect, the weather was just right and the Mexican food was delicious. Besides that, work's good and time has gone by pretty fast. I can't believe I've been at my new job for 3 months. Seems like soon I won't be able to claim claim "new girl" status anymore. In Seattle, we've been exploring plenty of dog friendly places and we try to discover new places every weekend. Most recently, my blog was featured on Stata News! It felt so awesome seeing my name (with an accent and everything) and my blog post mentioned there. Thank you, Stata! For those of you who left a comment in that blog post, I will respond to it shortly. Why haven't I kept up with my blog? Not sure I have a good answer for that one - the easiest explanation is lack of free time. Any free time I do have I spend it with my fiancé and my dog, running, doing yoga/barre, or exploring the city. I will strive for more blog posts. Really. I like blogging, I like writing and I like exploring my data and sharing it with you all. You presented it and we you blogged about it, so where's gcharts? Yes, I presented beta version at the conference. Will and I are working on it and hope to have it ready for public release in the next few weeks. Stay tuned. If you have any additional questions, feel free to ask away. Okay, now moving onto the blog post. So what has my steps data looked like from May to now? This is especially interesting as I did another half marathon in June and moved soon after. My schedule, work, and day to day activities have changed a lot since moving from San Diego. Below you'll see my average daily steps for the last 6 months compared to my friend Will's average daily steps. Interestingly, our steps show a similar trend leading up to and right after May 2016. May was my last full month in San Diego, so my hypothesis is that the decrease in joint work break walks and half-marathon training has something to do with that decrease for the both of us. Keeping with the tradition of posting monthly graphs, I've graphed our daily step activity for May through August below. As I mentioned earlier, Will and I ran the Rock'n'Roll Half on June 5th in San Diego which explains that spike. That date also happens to coincide with the personal record, in terms of daily steps (42,431 steps) and half-marathon finish time, of your's truly. 1:58:32. I know! Thank you. Not bad for my second half. Although, I must say that course was a lot easier than my first one. I also moved to Seattle in June and unfortunately for Will, the asphalt around Balboa Park was pretty bad so and he tripped and scraped his knees and palms around mile 8 or 9 of the course (he needed stitches) and so those injuries are the reason for his low step count that month. July is interesting in that there are a few days with very similar steps. A group of us, including Will, had Fitbit challenges (Work Week Hustle and Weekend Warrior Challenges - these are challenges through the app where you compete with friends in total steps during weekdays and weekends. More on that in a post to follow) and so I'm thinking that's why there are a lot of days with similar step activity, not sure though. I'll have to look into that and get back to you. August is funny. I didn't meet goal on a Saturday during my vacation! I tried, people, but Orange County is not that close to San Diego (traffic took a while) and lounging on the beach doesn't allow for many steps. Oh well, at least I had fun in the sun, and isn't that the point? Overall, August was a pretty good month for steps. Below, I've graphed our average hourly step count during weekdays (I also excluded holidays). I wanted to see what our graphs looked like together before and after I moved and I'm using Will's hourly step shape as a control. This data represents 60 days before and 60 days after moving. Interestingly, our hourly weekday graphs are very similar when I was in SD (March - May) and are not so similar when I moved (June-August). The similarity of our hourly graphs is due to the similarity in work schedules, meetings, lunch breaks, etc. Both of our hourly shapes changed after I moved. For me, the reason is that I walk more now that I don't drive to work and I'm allowed to bring my dog to the office so there's that difference, too. I take a couple of dog walks (about 2 a day, though, so not that many) 2-3 times a week. For Will, I'm not sure what's changed in his day-to-day, so you'll have to call and ask him. My speculation is now that our other friends/coworkers also have Fitbits/Garmin trackers maybe they take walks at different times. I'll find out. Now that I've updated you on the last few months of Fitbit activity, I thought it appropriate to look at the last year just to see what that all looks like. That's July 2015 - August 2016 average daily steps for the both of us. Cool, right? While, I only beat Will's average daily step count 4 out of 13 months, you can see how positive of an effect training for both half marathons had on our step activity. I'm tempted to sign up for another one soon, but it should definitely be held someplace warm. It's already cooling down over here and running outside is hard for this Southern Californian. Well, there you have it. I hope you've enjoyed this latest blog post. I'll leave you with this cool picture of my Rock'N'Roll race course graph as seen through my Fitbit app. I loved saying farewell to my favorite city by running through some of my favorite parts of it. In case you're wondering, Mission Bay is my absolute favorite running spot in San Diego. And just so you know what I'm talking about, here's a picture I took of Mission Bay on my last sunset run there. I know this isn't Instagram, so this should go without saying, but no filter was used to touch this picture up. Gorgeous, right? Until next time, blog readers.
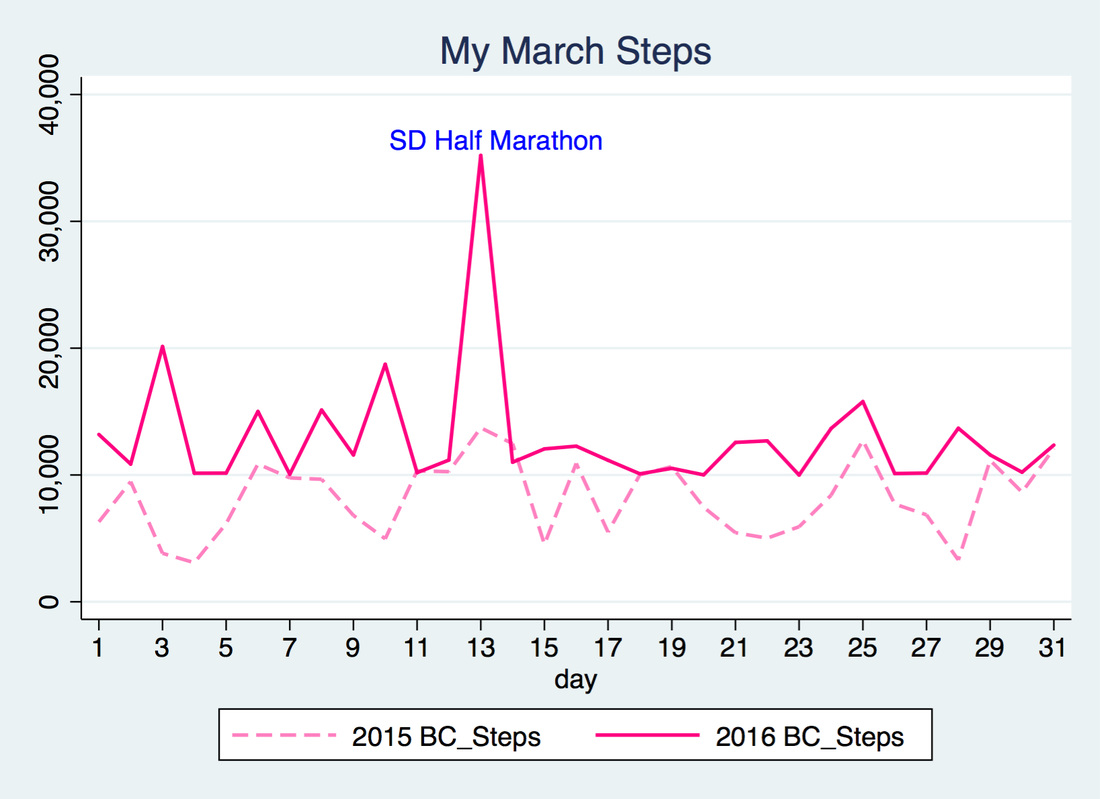
Well, I did it. I completed my first half marathon on March 13 and it was so much fun! I look forward to signing up for another half marathon as I found that training for a half marathon definitely increased my motivation for running and exceeding my step goals. I'll keep you posted on what race and when, but for now here's my step count comparison for March. Thanks to last year's data on my step count I can do an YoY comparison. Check out my improvements:
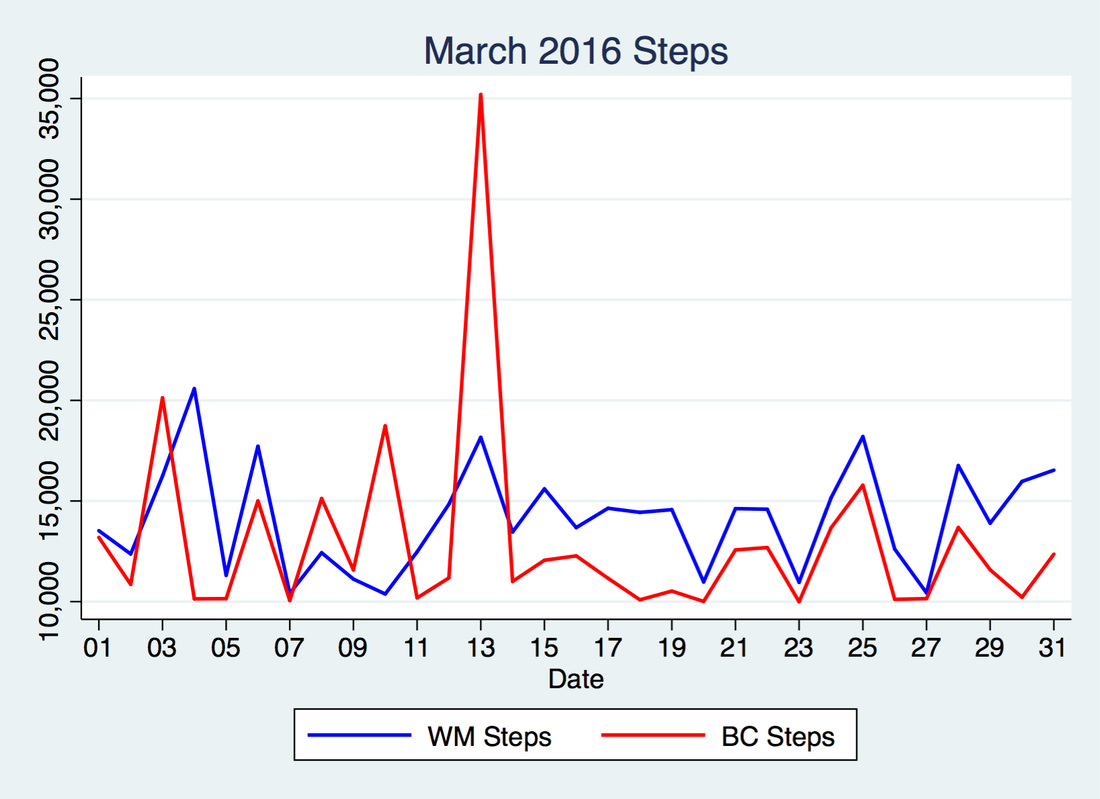
Now onto the comparison with Will. Clearly Will beat my step count most days. In fact, I only beat him 5 days out of 31. You can tell that after the half marathon my step count was well below Will's step count. To be fair, he has a half marathon coming up this month and he's been training for that. Like I said, race training means more steps. Will's March 2016 average daily step count: 14,149 and his total March 2016 steps was 438,630 (about 10% more steps than me).
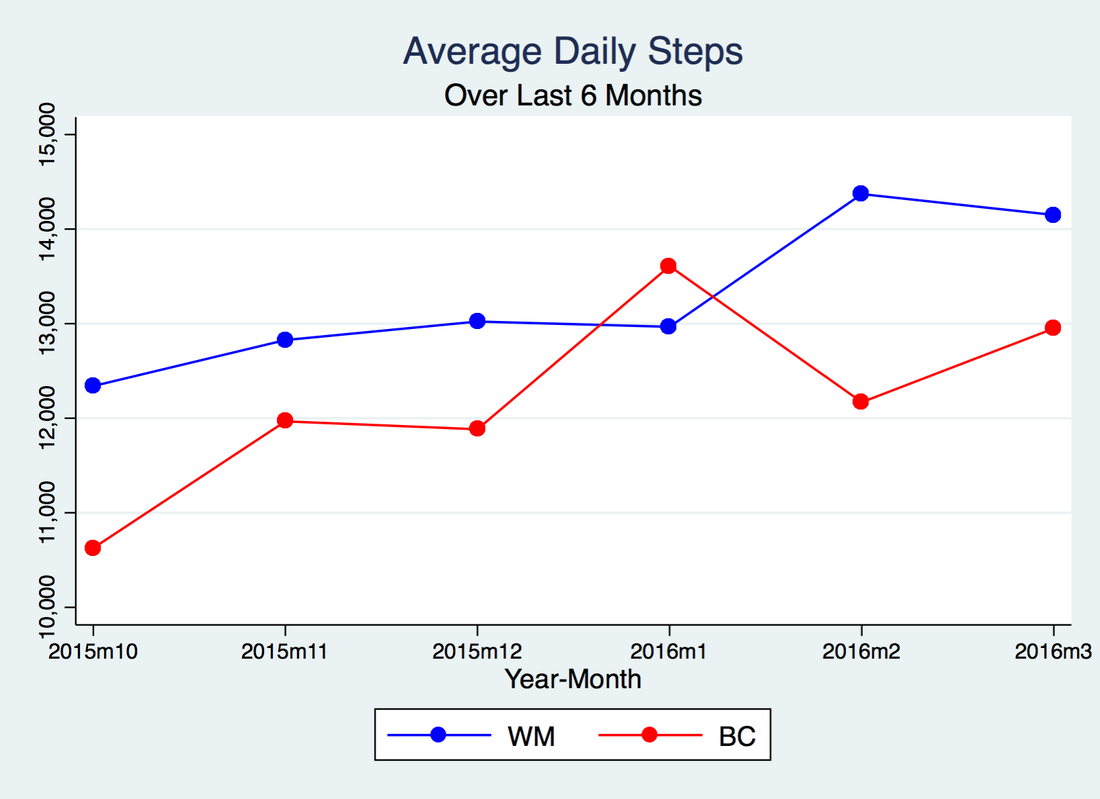
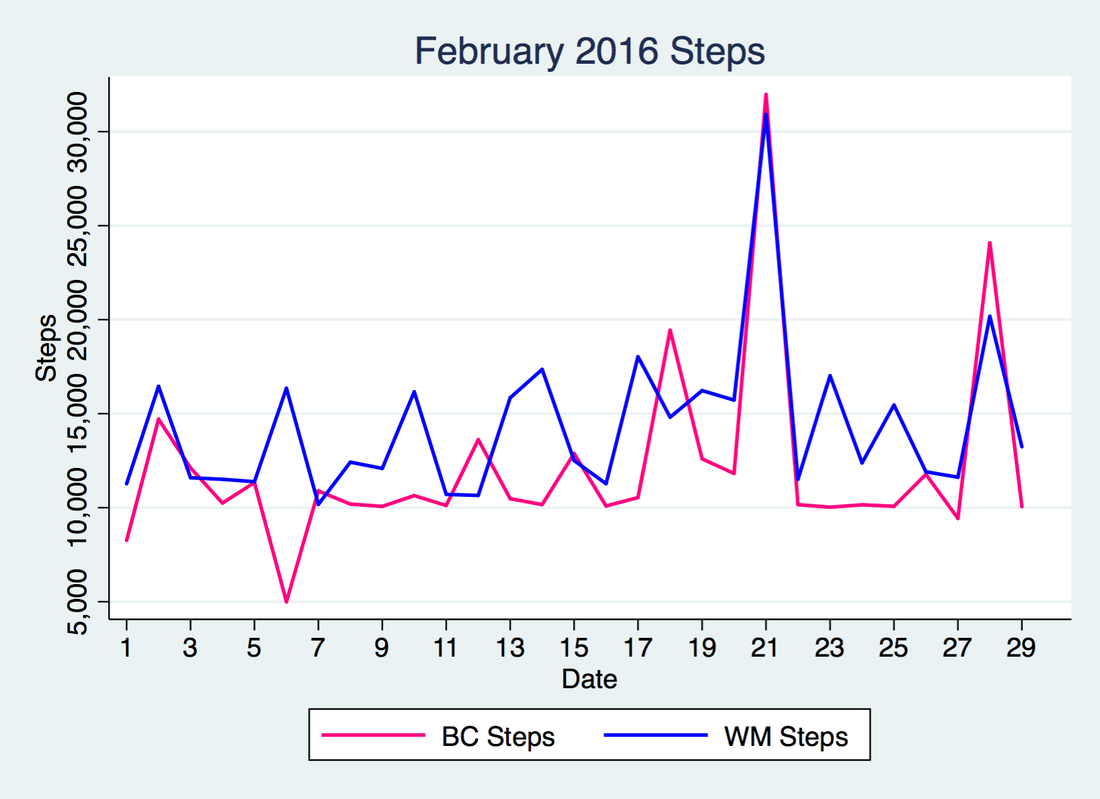
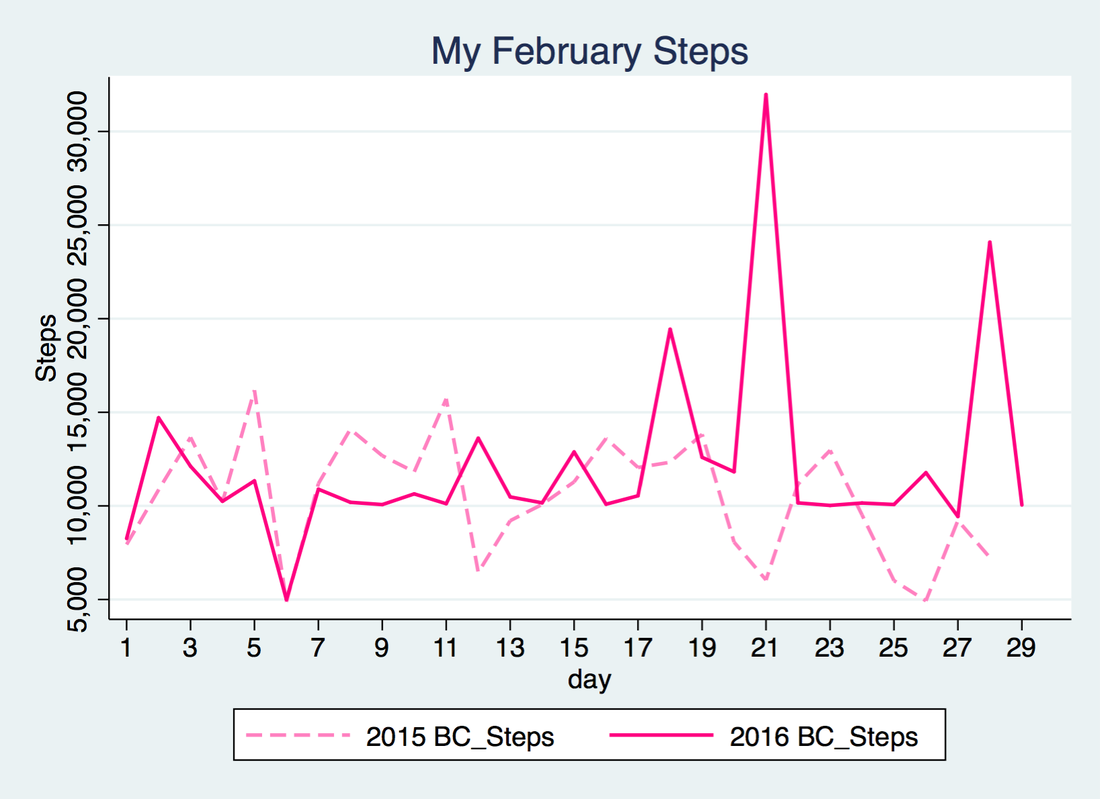
Seeing as both of us have been training for half-marathons and seem to be more competitive with our step counts, I've graphed our average daily steps for the last 6 months. There's clearly a positive trend and both of us are improving our step counts over time. Hope this trend keeps up :) Hello! It's been too long. I'm sorry for the lack of content. I'll make up for it soon, I promise. Here's the Fitbit step comparison for February with Will. Unfortunately for me I didn't beat Will last month, but here's to hoping March changes that! My February daily step average was 12,169 with a total of 352,914 monthly steps. Will's February daily step average was 14,370 with a total of 416,748 monthly steps. We are both training for half marathons, so we ran about 9 or 10 miles on those two days with spikes. Yes! We both got above 30,000 steps on the same day. Will's new personal record is 30,912 while mine is a tiny bit higher at 31,975. Sorry, not sorry, Will. I missed goal 3 times last month. I was sick in the beginning of the month with an annoying cough due to running during a rainy day with crazy winds. That cough kept me from training for a good 2 weeks. Excuses, I know, but hey! it's true. Now that I've had my Fitbit for a little over a year, I can make annual comparisons. My February 2015 daily step average was: 10,471 with a monthly total of 293,196. In terms of totals, that's about 17% lower than this year (taking the extra day into account). Talk about healthier habits thanks to half-marathon training-- maybe I should keep this up and actually turn into a runner. Last year I missed goal 11 times and interestingly for both years I didn't meet goal on February 6th. This year it was due to being bedridden with a cold and last year it was due to commuting from San Diego to Glendale. I thought it was interesting how my total daily steps are almost exact. My half marathon is in just a few days. That should be a nice spike on next month's update. Wish me luck!
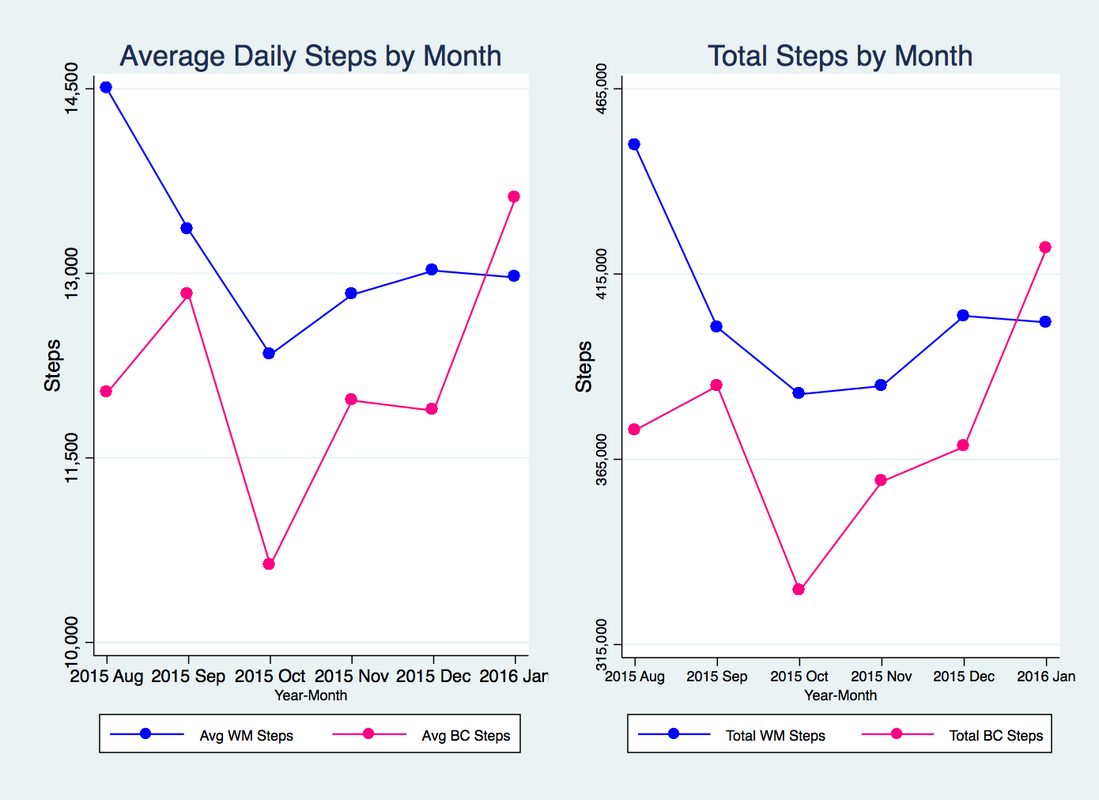
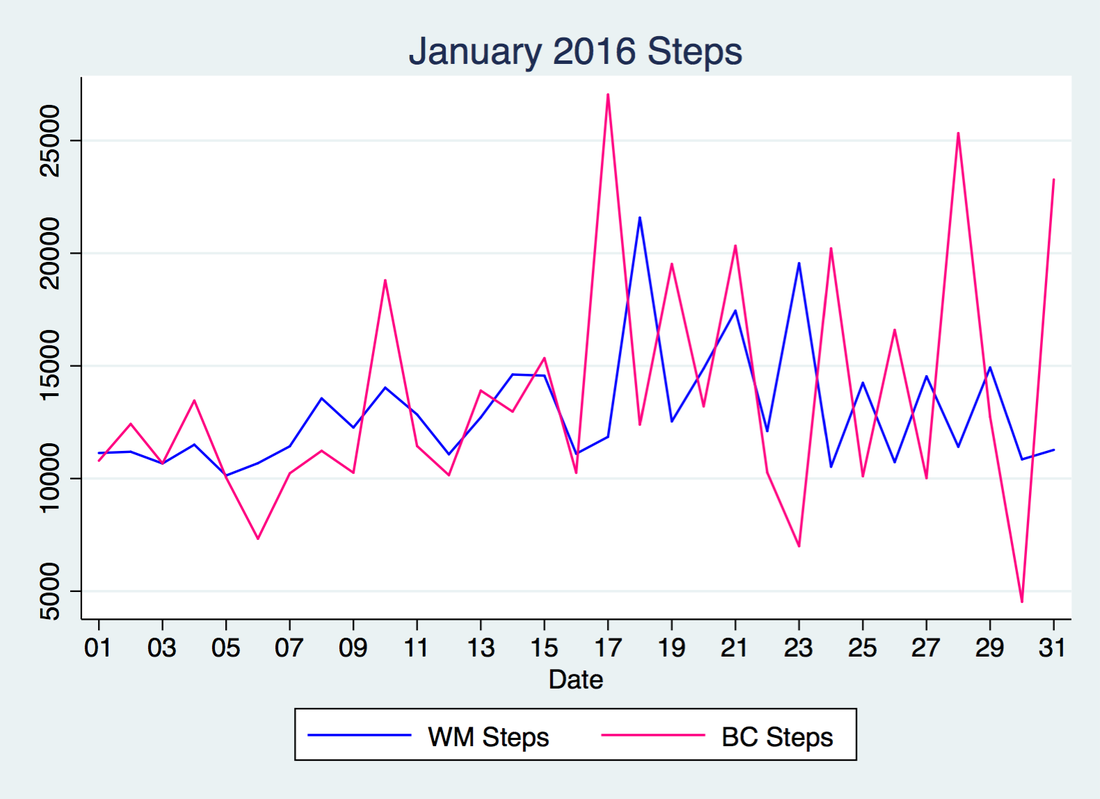
I am proud to say that my half-marathon training has increased my step count. January 2016 has been my best month yet. Totally patting myself on the back. Below I've graphed my average daily step count and my total monthly step count and comparing it to Will's for the last 6 months. Recall that I had my Fitbit stolen in October which is why there's a dip in October 2015. My average daily steps in January: 13,608 versus Will's 12,966. My total monthly steps in January: 421,858 versus Will's 401,965. I had a 14.5% increase in activity from December to January. While Will had a minuscule drop in step activity (about -0.4% change). Below is what the daily step counts looked like. The spike on the 17th is my personal record for most daily steps. It also beats Will's daily record of 25,370 steps. I got 27,026 steps that day. Note that in 2015, my daily step record was 20,825. In January 2016 I managed to get above 20,000 steps 5 times. (I only got above 20,000 steps 3 times in 2015). Hooray for running and training! In the last couple of weeks I've slowed down on my training due to a bug I caught, but I'll be running again soon. Stay tuned for February's update next month :)
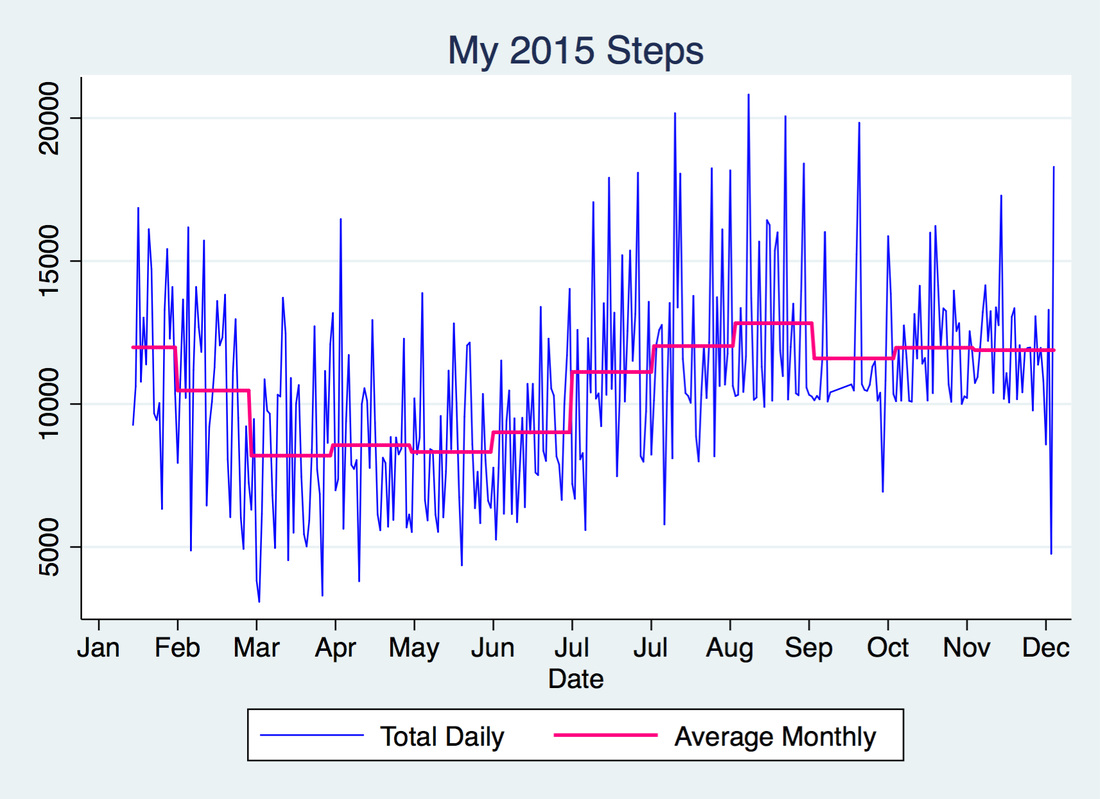
I got my Fitbit on January 15, 2015 and I have been obsessed with it ever since (sorry not sorry, friends and family). I figured that now that 2015 is over, I'd look at my step trends for the year. The graph above shows my total daily steps in blue and my average monthly steps in pink. As you can see, my average daily steps went up after July and remained above 10k throughout the end of the year.
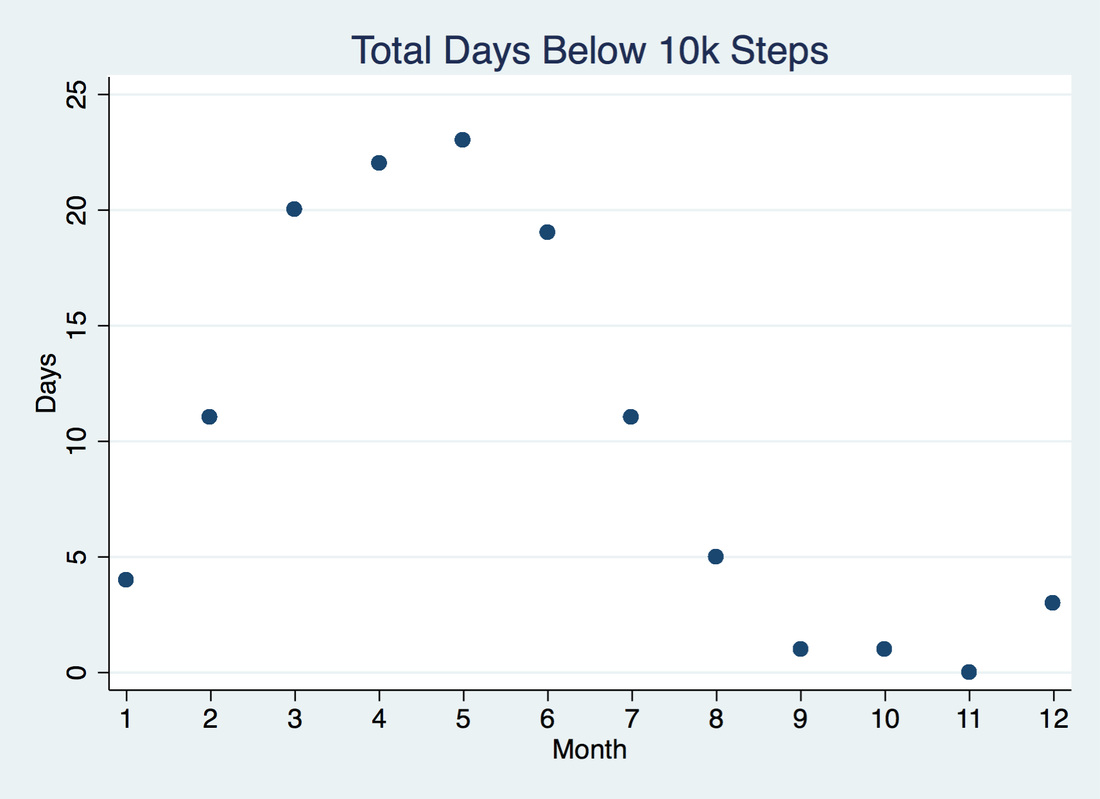
I wasn't meeting goal very often before July and this is evidenced in the graph below. It counts how many times I missed my step goal for every month in 2015:
I got better at meeting goal and became more competitive as more people I knew (like Will) got Fitbits and challenged me with Fitbit's Goal Day, Weekend Warrior, Daily Showdown and Workweek Hustle challenges.
Using Stata and Google Charts API I made the following graphic which shows my steps above or below my goal of 10k.
This was motivated by my Fitbit & Google Calendar Chart blog post. The legend is similar:
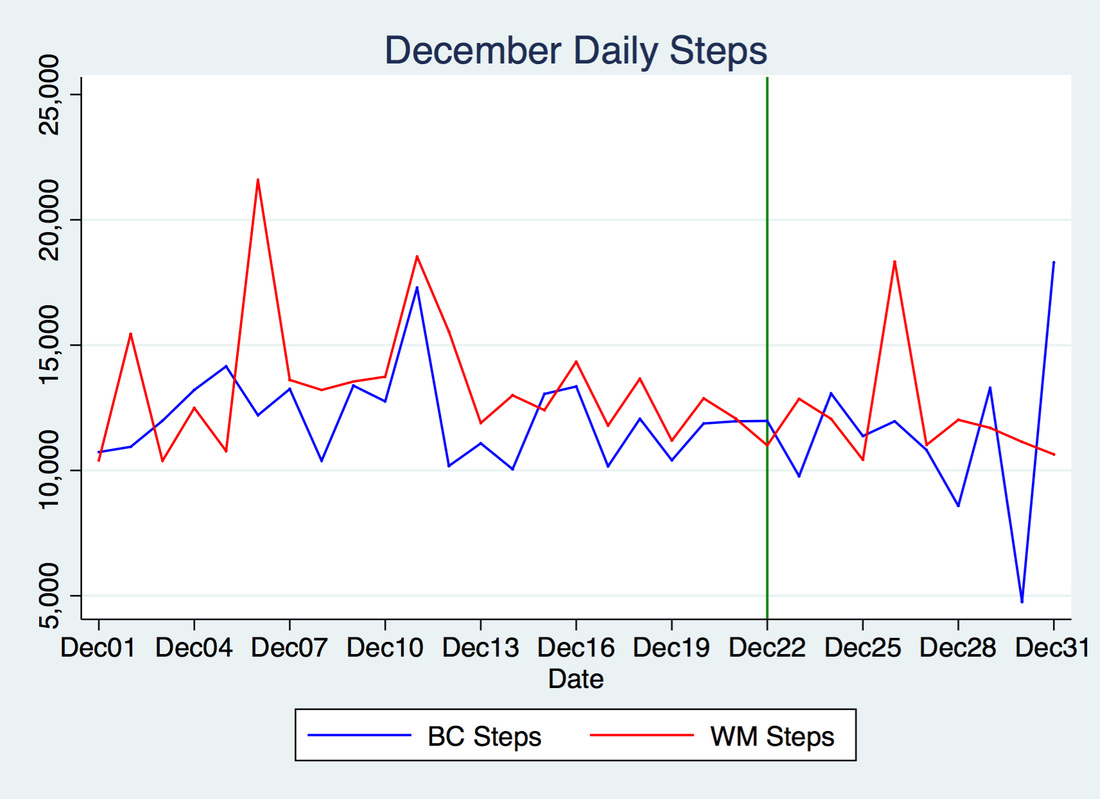
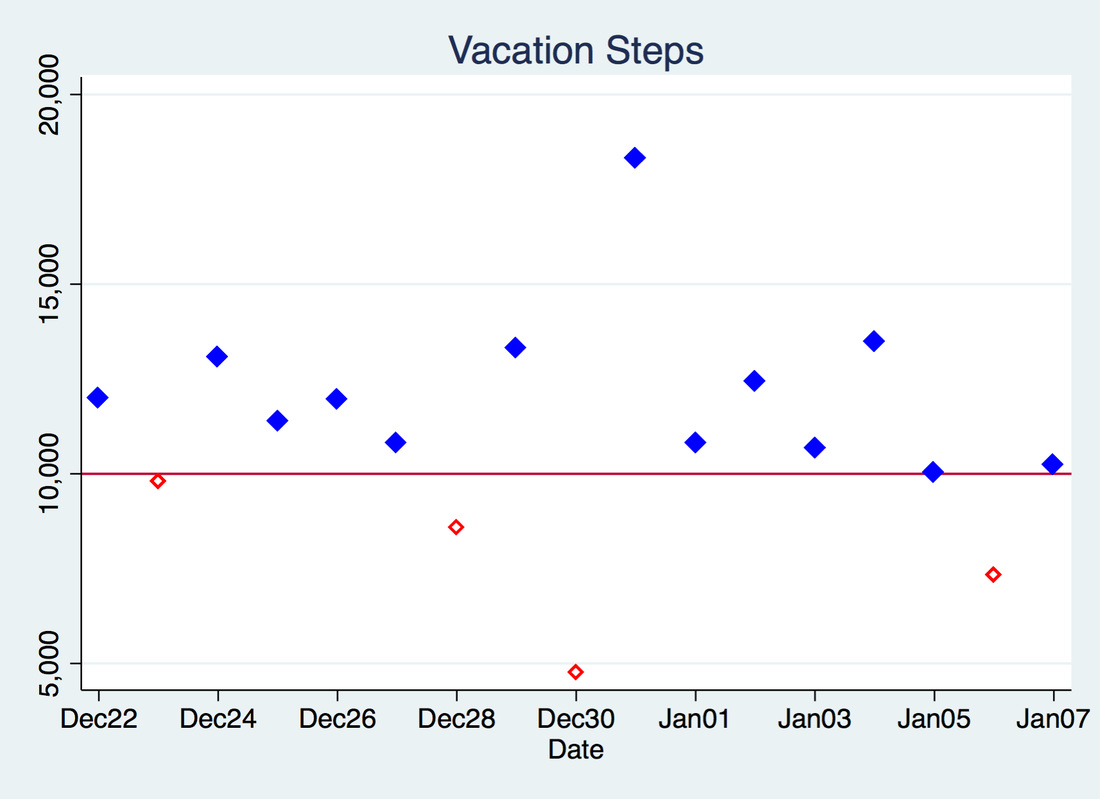
This includes a total of 344 days. My average daily steps for 2015 was 10,593 steps, and for the months of July through December was 11,910. Also, as the Stata graphs above illustrate, the months of February through June show a lot of days where I missed my step goal. For 2016, I'm aiming to have a lot more blue cells with darker shades of blue. That's my resolution :) Happy New Year! I was on vacation for the last couple weeks of December and the first week of January, so apologies for the lack of updates. Last month, I was hoping to reach above 25k steps and was striving to maintain my 10k step goal streak. Unfortunately, neither of those were realized. To be fair, getting steps in while on vacation is pretty difficult when all venues you go to require driving. Also, the time change really messed up my schedule (it's a 5 hour difference), it was too hot sometimes, and a little dangerous at times in terms of safety. I know, excuses excuses, but I tried! Really! There were times where I walked by myself, went on runs by the beach, and used the treadmill. Who brings running shoes to vacation? This girl, because goals need to be met and Brazilian food is too delicious. Anyway, on to the December update. Below are the total daily steps for Will and me for last month. Both of us were out of the office beginning on December 22 which is denoted by the vertical green line. Will's steps are in red and my steps are in blue. As expected, Will met goal every day. Good job, Will! I however, did not meet goal for 3 days last month. Below are my vacation days up through Thursday: Ok, whoa! Below 5000 steps? I know...Insert extremely embarrassed emoji here. That day, I woke up pretty late around 10 am and went to the beach with my friends up until 4 pm, after which we went to dinner. I later went out with my fiancé and his friends. So no time for walking.
On the 23rd, I arrived in Brazil and due to the time difference I only got 9,773 steps. I was pretty mad about that one. On the 28th I had 1500 steps to go and didn't meet it due to step procrastination (I had 2k steps to go as of 11 PM and figured I'd meet goal during that hour - we went out for a late dinner so sitting was how I spent that last hour). On January 6 I was traveling to the airport and spent most of the day packing, preparing for my trip, and saying good-bye to people, so I only got 7,327 steps. Really bummed about that one because I was hoping for a goal streak in 2016. Womp womp. Anyway, as of today I have 64 days until the San Diego Half Marathon and I am certain step goals will be met due to training. Stay tuned!
I was playing around with some Google Charts yesterday and I stumbled across their Calendar charts. I thought it would be cool to display changes in Fitbit activity by displaying step differentials using this visualization.
The legend is as follows:
The chart above shows 145 days of data with varying levels of competition. Unfortunately for me, there are mostly blue cells. Will's a runner, so unfair advantage, right? With the exception of September, I beat Will's step count for a total of 7-8 days out of the month. In September I beat his step count for a total of 14 days. Still, that was only 46% of the days in July. Go Will! He takes the lead 75% of the time. You can see the cell colors becoming lighter from July to November. In other words, the step counts were converging, meaning 1 of 2 things: 1) We got more competitive, or 2) we both got less competitive as time went on. See for yourself below:
Looks like a slight downward trend from August to November.
These cool charts were made in Stata and use Google Charts API :)
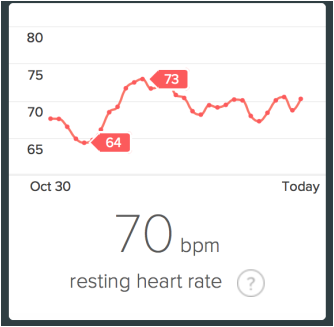
If you have a Fitbit Charge HR, have you ever tried looking at your historical heart rate data through Fitbit's App or Dashboard? Unfortunately, you can only see 30 days worth of data, and that's about it (see picture below). Which I think is weird considering you can see your historical step data from day 1.
If you're curious like me and want to retrieve your historical resting heart rate using Fitbit's API, then this blog post is for you!
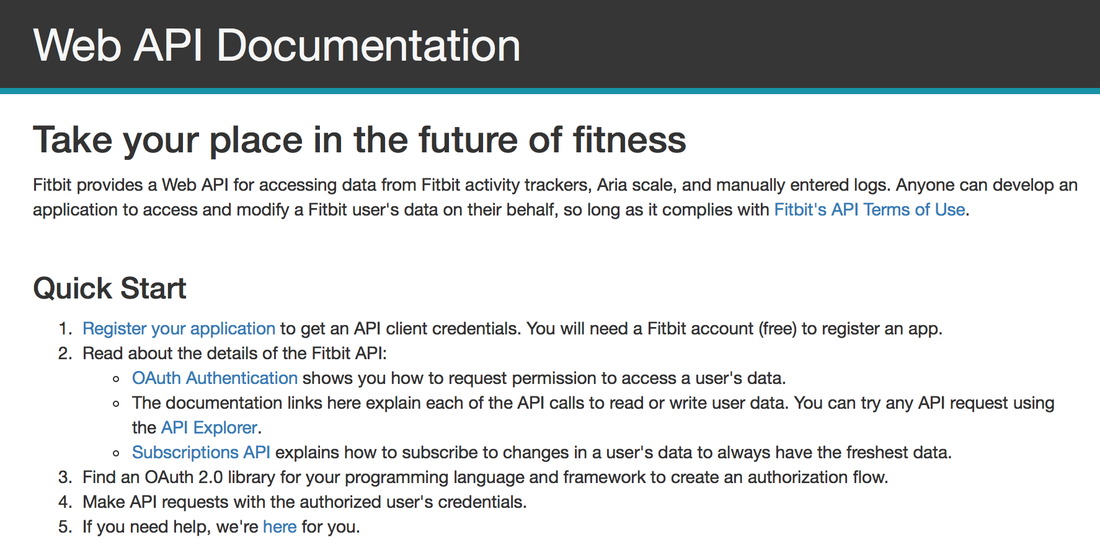
I have a registered app through Fibit Developer API and I use Fitbit's API explorer to download my own data. For steps on using Fitbit's API go to www.dev.fitbit.com/docs. The steps for the API are also below:
Skipping to step 2, I use the Fitbit API Explorer to get my heart rate information by typing the following request URL and replacing the USERNUM with my user number, and replacing the to- and from- dates.
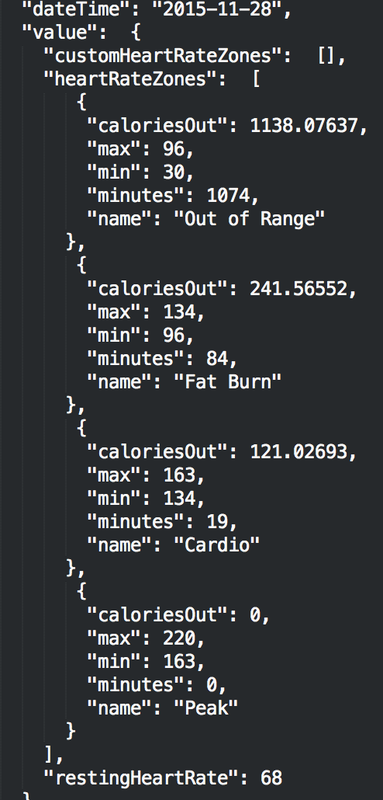
The resulting response is in JSON format which I then parse using Stata. The screenshot below shows the JSON file for yesterday's heart rate information. Unfortunately, the output doesn't contain continuous heart rate information, but it does tell me calories burned in each of the rate zones, as well as the resting heart rate for each day. Just curious, does anyone know where I can get continuous heart rate information?
The file is parsed using the following code, keeping only the date and resting heart rate:
/* Author: Belen Chavez */
/* Parse daily heart data from Fitbit JSON file */

clear
version 12.1
global fname "bc_heart.txt"

forv i = 1/7{
        tempfile f`i'
}

filefilter $fname `f1', f("{") t("")
filefilter `f1' `f2', f("},") t("")
filefilter `f2' `f3', f("[") t("")
filefilter `f3' `f4', f("],") t("")
filefilter `f4' `f5', f(",\n") t(",")
filefilter `f5' `f6', f("}") t("")
filefilter `f6' `f7', f(":") t(",")

insheet using `f7', clear delimit(",")
keep if v1=="dateTime" | v1=="restingHeartRate"
drop v3-v10

gen date = date(v2,"YMD") if v1=="dateTime"
gen resting = v2 if date==.
replace resting = resting[_n+1] if resting==""
keep if date!=.
destring resting, replace
format date %td
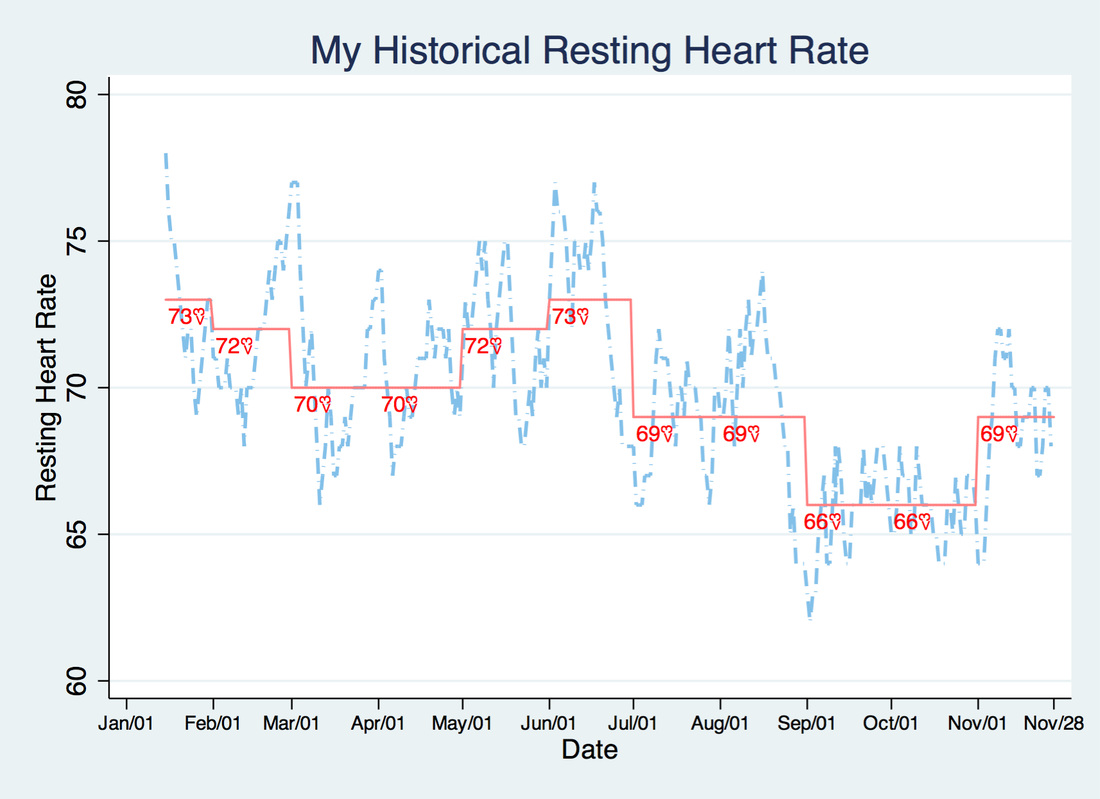
The graph below shows the historical resting heart rate that Fitbit has on me ever since I got my Charge HR:
The dashed line represents my daily resting heart rate (beats per minute), the pink solid line represents my monthly average resting heart rate and the red numbers with the "<3" symbols detail what the monthly average is.
Interestingly, my resting heart rate is quite variable and seems cyclical, with the lowest range in September and October. Does anyone else's heart rate look like this? I read up on this and apparently resting heart rates vary due to medications, illness, fitness levels, and stress. In a few weeks I'll be going on vacation and taking some time off work, I'm expecting my resting heart rate to go down when I'm not at the office, but, we'll see what happens. Also, in a couple of months, I will have had my Charge HR for a year, and I also look forward to looking at the year-on-year change. I'll post more on that in late January or early February! Update April 20- Here's the code I used to make the graph above:
gen ym = mofd(Date)
egen avg_resting = mean(resting), by(ym)
format avg %6.0f
format Date %tdMon/DD
tostring avg_resting, gen(avg_str) usedisplayformat force
gen hearts = "<3"

 * Create a mid-month variable to place the markers
gen midmo = Date if day(Date)==15
 * Create a shifted mid-month variable for the heart markers
gen midmo1 = midmo+4

twoway (line resting Date, ///
        lcolor(eltblue) lpattern(dash_dot) lwidth(medthick)) ///
        (line avg_resting Date, lcolor(red*.40)) ///
        (scatter avg_resting mid,  ///
        msymb(none) mlab(avg_str) mlabcolor(red) mlabposition(6))  ///
        (scatter avg_resting midmo1, ///
        msymb(none) mlab(hearts) mlabcolor(red) mlabposition(6) mlabgap(2) ///
        mlabangle(90) mlabsize(*.75)), xlabel(#12, labsize(*.70)) legend(off)  ///
        title("My Historial Resting Heart Rate")
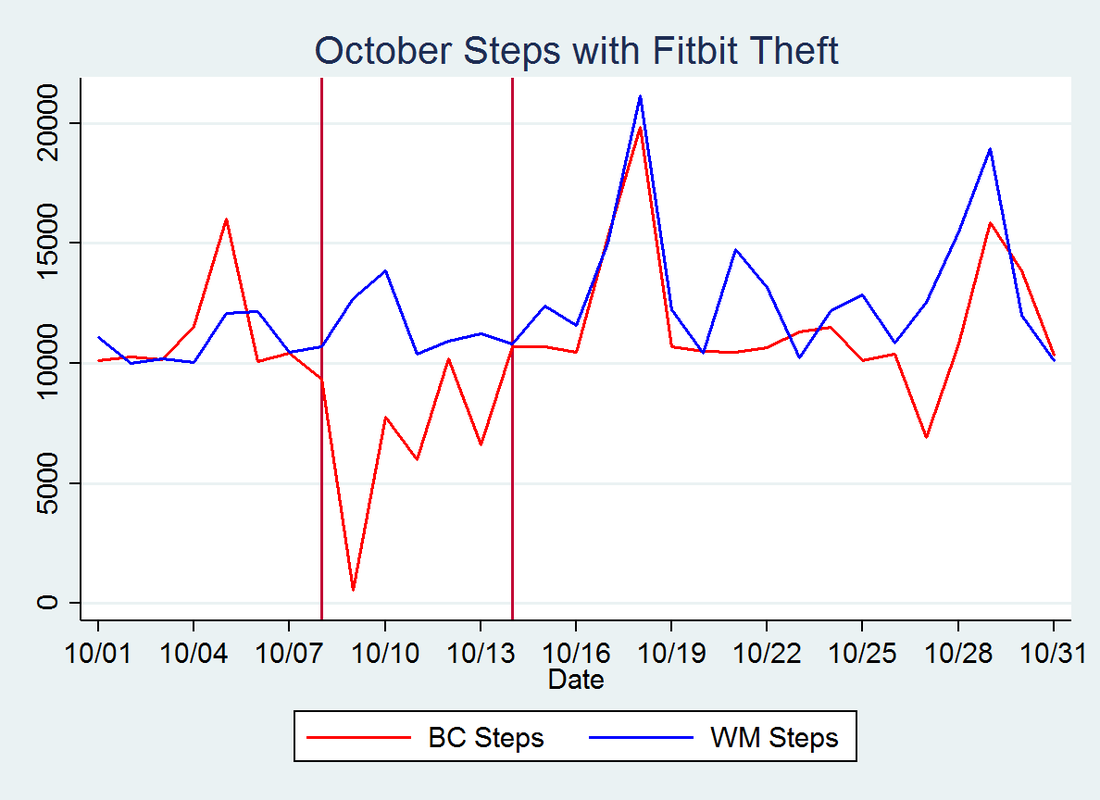
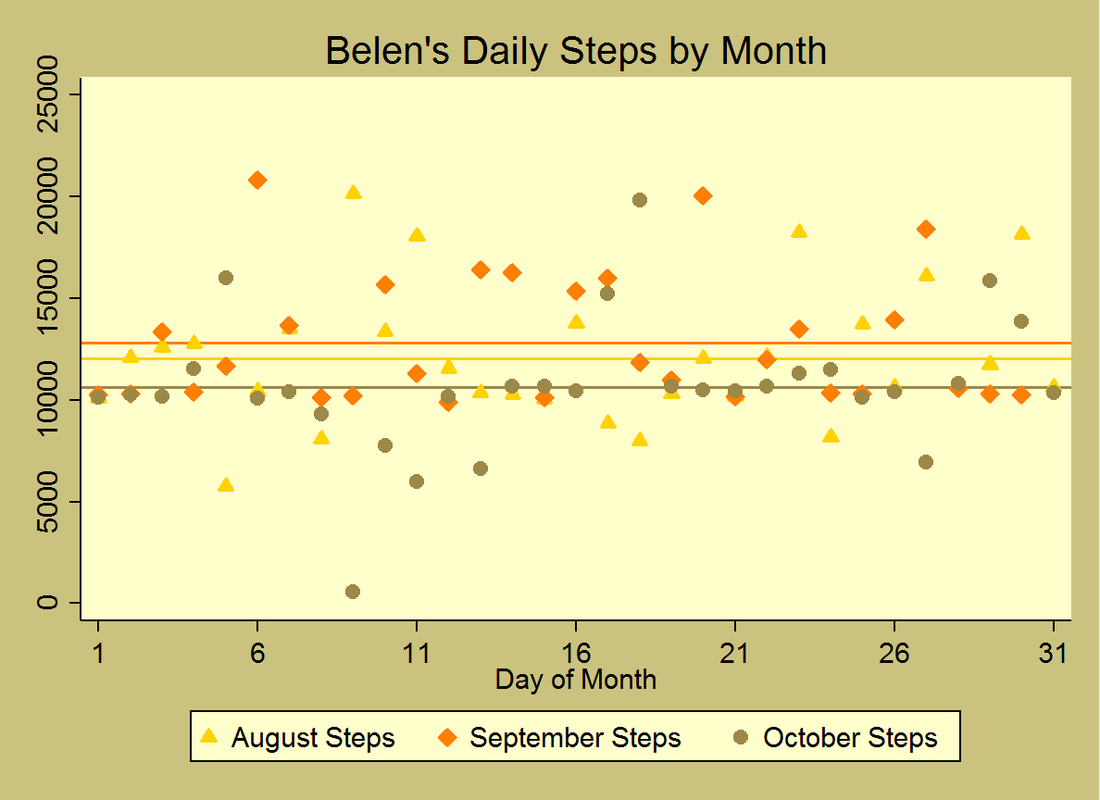
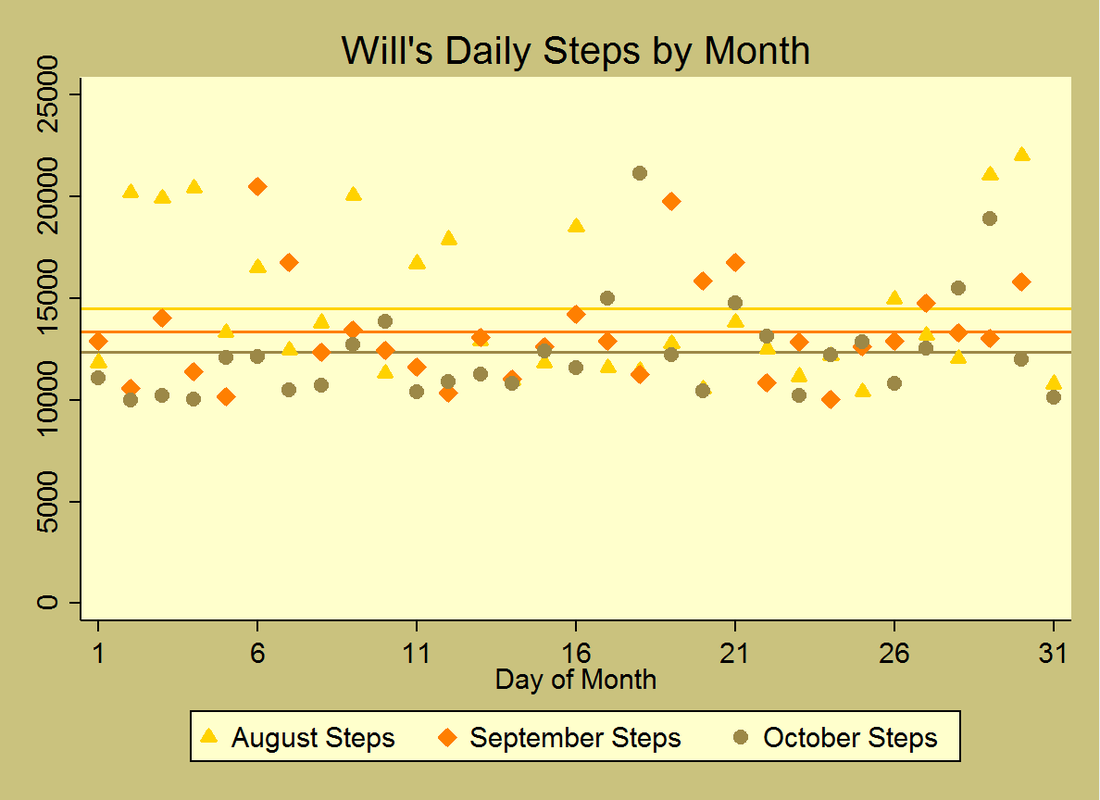
As you recall, I was without my Fitbit for a few days in early October due to someone taking it. I've compared Will's daily steps to my daily steps for the month of October in the graph below: The vertical red lines show the time period that I was without my Fitbit and the few days after where I was told I was being a baby by refusing to wear it (but it smelled like someone else's perfume!). That time span was a total of about 6 days. Interestingly, Will's step count decreased while I was without my Fitbit. After I got it back and started getting back to my usual schedule, both of our step counts increased. My motivation suffered as a result of losing my month-long streak that I had pre-Fitbit theft, and Will's motivation seems to have declined as a result of my lack of motivation, too. Altogether, our steps were less correlated in October than they have been in any other month even after accounting for the theft time period. Having experienced this drop in steps, I wanted to see what our step counts have looked like in the last few months. See Thanksgiving-theme step graphs below. The colors go from yellow to brown to reflect changing leave colors in Autumn. The scatter points are our total daily steps and the horizontal lines reflect the monthly averages. As you can see, our step counts have decreased in the last few months. While my step count increased slightly in September, October's step count was lower than both August's and September's step counts. Will's step count decreased monthly from August to October. His total step count decreased by 10.9% from August to September, and decreased 4.5% from September to October. I've kept track of my November steps and made it a point to not go below my goal of 10,00 steps a day! Stay turned for November's Fitbit update coming in the next week or so.
|
AuthorMy name is Belen, I like to play with data using Stata during work hours and in my free time. I like blogging about my Fitbit, Stata, and random musings. Archives
March 2018
Categories
All
|
