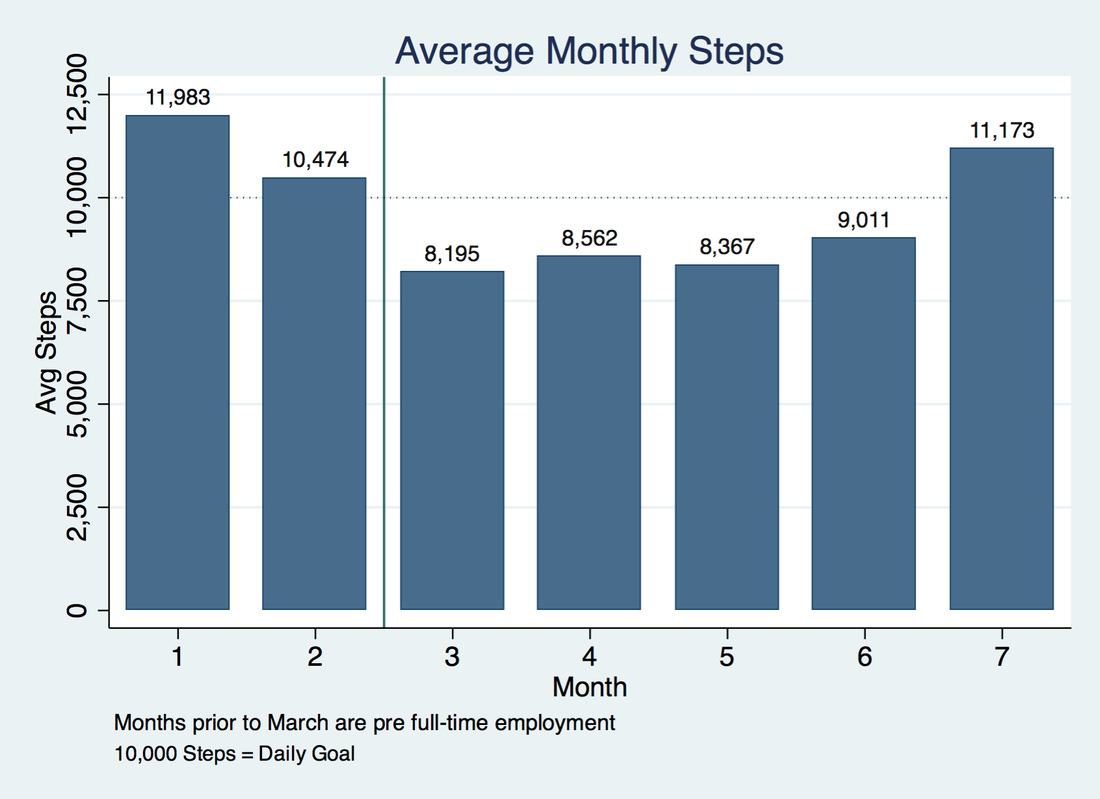
 This graph was made using Stata 12. Data was downloaded from my Fitbit.com dashboard. Recently a few of my coworkers purchased Fitbits and we've been having friendly competitions to see who can get the most steps. I know, it kind of sounds lame, but not surprisingly, I've found that I'm exceeding my steps goal on a daily basis since they bought theirs. Here's a snapshot of my Fitbit App's average steps taken on a monthly basis.
January and February were months where I was super motivated to meet my step goal, which was probably driven by my New Year resolutions and by the "new Fitbit" effect (whereby one wants to meet daily step goals to justify the Fitbit purchase). I was also unemployed in those two months and had more time to walk/run/play. In March, I started a new full-time job and became more sedentary. July is where my steps start to go up again which I like to attribute to competition. I'm generally a competitive person, so this makes sense. Plus, no one likes to lose, right?
0 Comments
A little background: I have had a Fitbit Charge HR since January of 2015 and I've been playing with my steps data, heart rate data, and sleep data thanks to their phone app and website. I'm waiting to have enough data to tell me if the the steps I take influences my sleep quality, to see how my resting heart rate fluctuates over time, to see how different fitness instructors help me burn calories, and other such Fitbit/health topics. 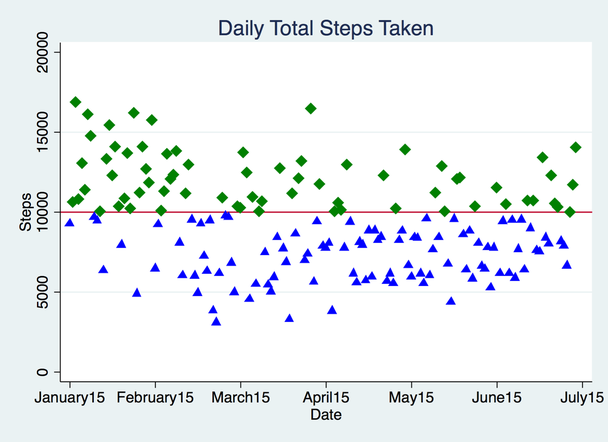 This graph was made using Stata 12. Data was downloaded from my Fitbit.com dashboard. |
