|
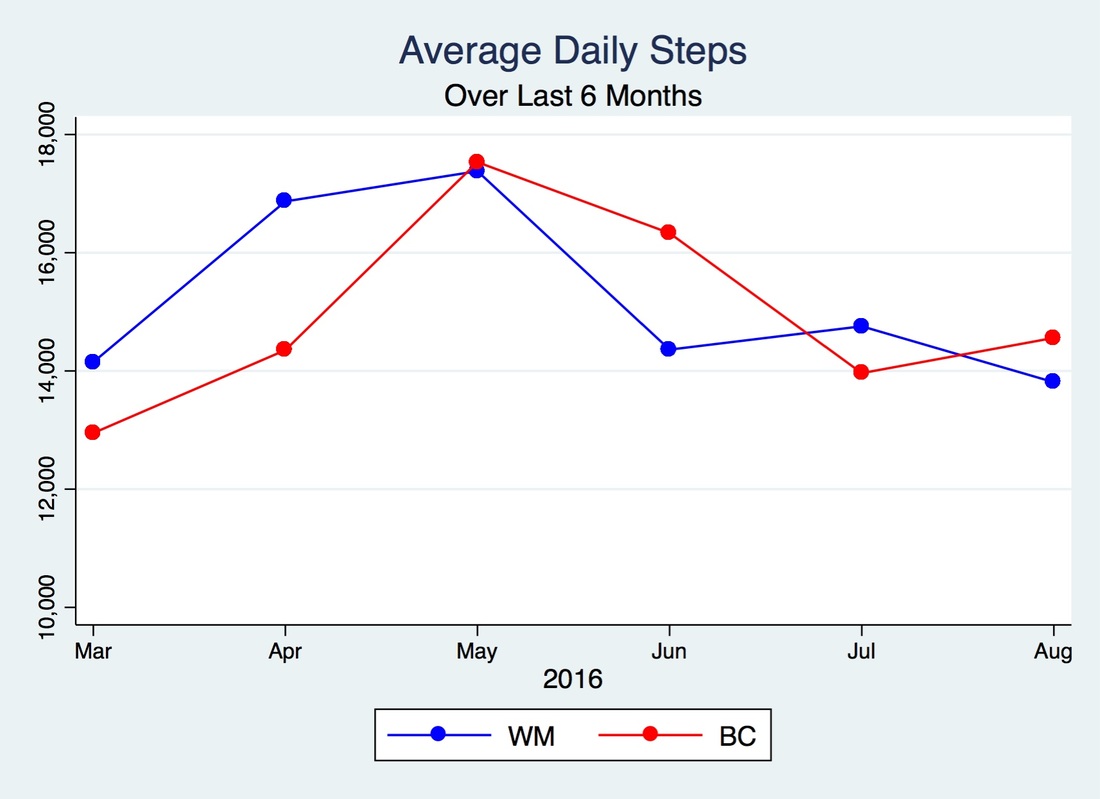
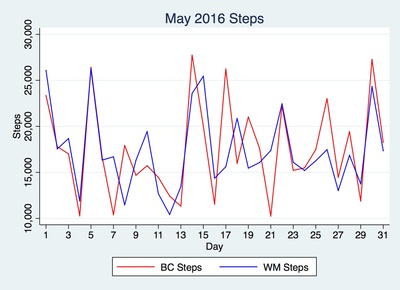
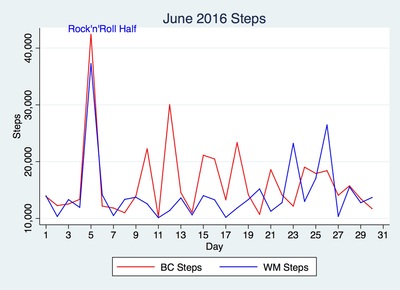
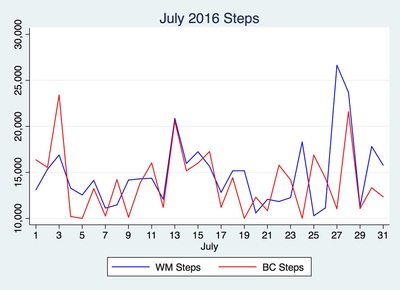
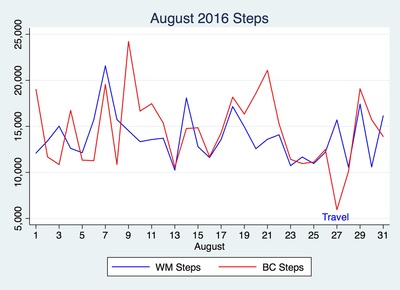
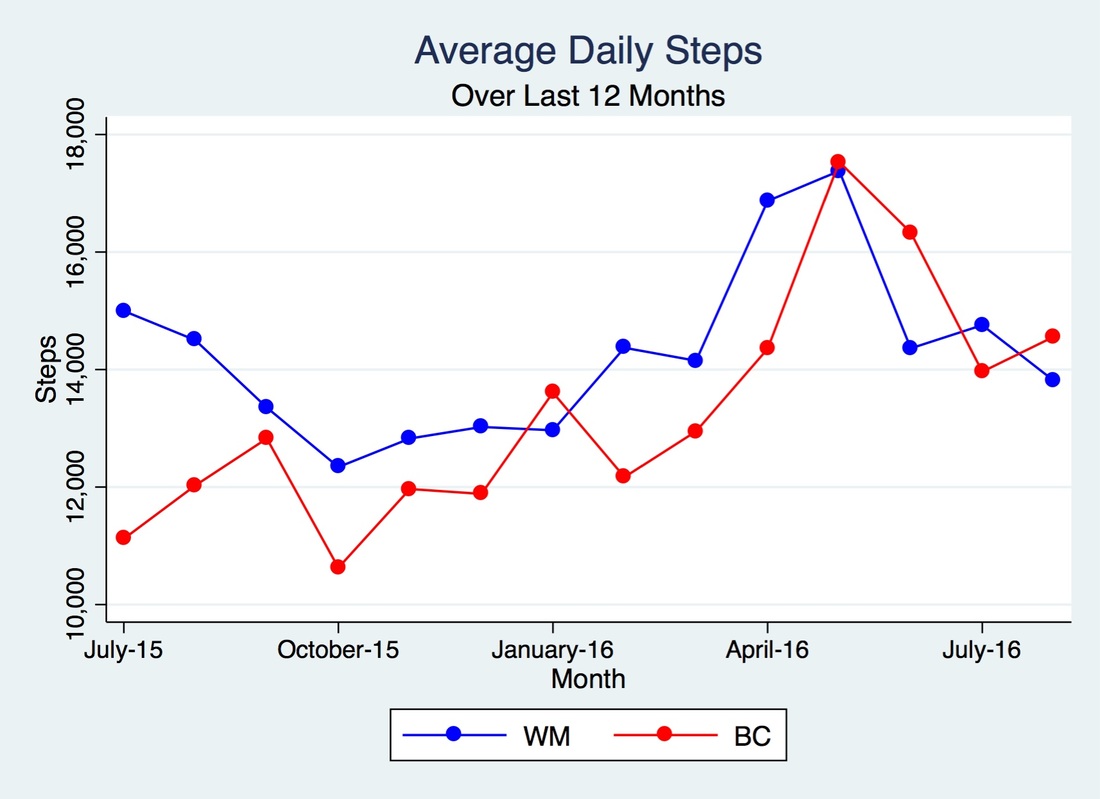
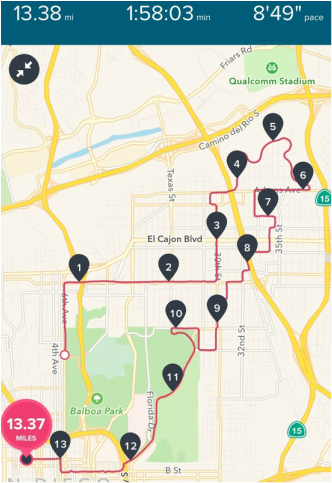
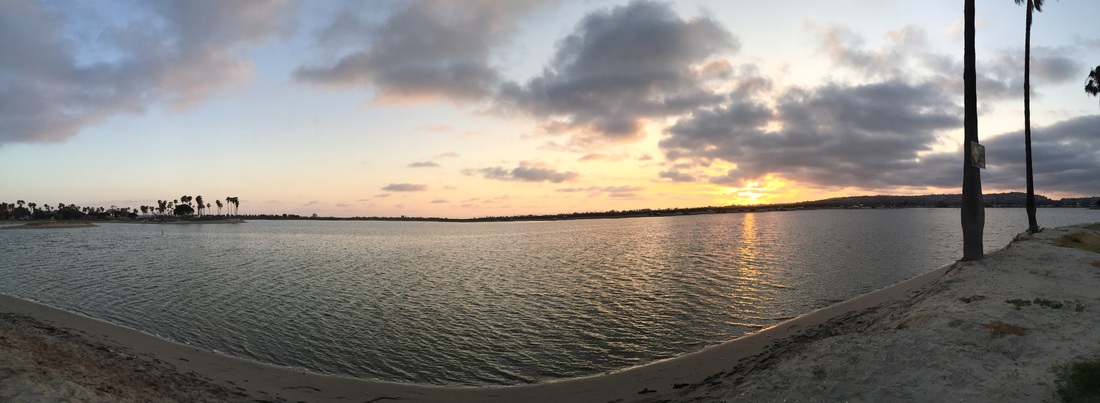
Hello, again blog readers! It's been about 60 days since my last post and it's about time I did another Fitbit step comparison - the last one I did was in April. Yikes. Before I jump into that, let me take a minute to answer some questions you might have: What's new? Well, since I last blogged, a few things have happened. Like I went to Chicago to present at the Stata Conference and that was pretty awesome. I've never presented at a professional conference and our work was very well received. I got to visit San Diego a few weeks ago and that was very nice. We got to see old friends and hang out with family. I loved going back home. The beach was perfect, the weather was just right and the Mexican food was delicious. Besides that, work's good and time has gone by pretty fast. I can't believe I've been at my new job for 3 months. Seems like soon I won't be able to claim claim "new girl" status anymore. In Seattle, we've been exploring plenty of dog friendly places and we try to discover new places every weekend. Most recently, my blog was featured on Stata News! It felt so awesome seeing my name (with an accent and everything) and my blog post mentioned there. Thank you, Stata! For those of you who left a comment in that blog post, I will respond to it shortly. Why haven't I kept up with my blog? Not sure I have a good answer for that one - the easiest explanation is lack of free time. Any free time I do have I spend it with my fiancé and my dog, running, doing yoga/barre, or exploring the city. I will strive for more blog posts. Really. I like blogging, I like writing and I like exploring my data and sharing it with you all. You presented it and we you blogged about it, so where's gcharts? Yes, I presented beta version at the conference. Will and I are working on it and hope to have it ready for public release in the next few weeks. Stay tuned. If you have any additional questions, feel free to ask away. Okay, now moving onto the blog post. So what has my steps data looked like from May to now? This is especially interesting as I did another half marathon in June and moved soon after. My schedule, work, and day to day activities have changed a lot since moving from San Diego. Below you'll see my average daily steps for the last 6 months compared to my friend Will's average daily steps. Interestingly, our steps show a similar trend leading up to and right after May 2016. May was my last full month in San Diego, so my hypothesis is that the decrease in joint work break walks and half-marathon training has something to do with that decrease for the both of us. Keeping with the tradition of posting monthly graphs, I've graphed our daily step activity for May through August below. As I mentioned earlier, Will and I ran the Rock'n'Roll Half on June 5th in San Diego which explains that spike. That date also happens to coincide with the personal record, in terms of daily steps (42,431 steps) and half-marathon finish time, of your's truly. 1:58:32. I know! Thank you. Not bad for my second half. Although, I must say that course was a lot easier than my first one. I also moved to Seattle in June and unfortunately for Will, the asphalt around Balboa Park was pretty bad so and he tripped and scraped his knees and palms around mile 8 or 9 of the course (he needed stitches) and so those injuries are the reason for his low step count that month. July is interesting in that there are a few days with very similar steps. A group of us, including Will, had Fitbit challenges (Work Week Hustle and Weekend Warrior Challenges - these are challenges through the app where you compete with friends in total steps during weekdays and weekends. More on that in a post to follow) and so I'm thinking that's why there are a lot of days with similar step activity, not sure though. I'll have to look into that and get back to you. August is funny. I didn't meet goal on a Saturday during my vacation! I tried, people, but Orange County is not that close to San Diego (traffic took a while) and lounging on the beach doesn't allow for many steps. Oh well, at least I had fun in the sun, and isn't that the point? Overall, August was a pretty good month for steps. Below, I've graphed our average hourly step count during weekdays (I also excluded holidays). I wanted to see what our graphs looked like together before and after I moved and I'm using Will's hourly step shape as a control. This data represents 60 days before and 60 days after moving. Interestingly, our hourly weekday graphs are very similar when I was in SD (March - May) and are not so similar when I moved (June-August). The similarity of our hourly graphs is due to the similarity in work schedules, meetings, lunch breaks, etc. Both of our hourly shapes changed after I moved. For me, the reason is that I walk more now that I don't drive to work and I'm allowed to bring my dog to the office so there's that difference, too. I take a couple of dog walks (about 2 a day, though, so not that many) 2-3 times a week. For Will, I'm not sure what's changed in his day-to-day, so you'll have to call and ask him. My speculation is now that our other friends/coworkers also have Fitbits/Garmin trackers maybe they take walks at different times. I'll find out. Now that I've updated you on the last few months of Fitbit activity, I thought it appropriate to look at the last year just to see what that all looks like. That's July 2015 - August 2016 average daily steps for the both of us. Cool, right? While, I only beat Will's average daily step count 4 out of 13 months, you can see how positive of an effect training for both half marathons had on our step activity. I'm tempted to sign up for another one soon, but it should definitely be held someplace warm. It's already cooling down over here and running outside is hard for this Southern Californian. Well, there you have it. I hope you've enjoyed this latest blog post. I'll leave you with this cool picture of my Rock'N'Roll race course graph as seen through my Fitbit app. I loved saying farewell to my favorite city by running through some of my favorite parts of it. In case you're wondering, Mission Bay is my absolute favorite running spot in San Diego. And just so you know what I'm talking about, here's a picture I took of Mission Bay on my last sunset run there. I know this isn't Instagram, so this should go without saying, but no filter was used to touch this picture up. Gorgeous, right? Until next time, blog readers.
0 Comments
|
AuthorMy name is Belen, I like to play with data using Stata during work hours and in my free time. I like blogging about my Fitbit, Stata, and random musings. Archives
March 2018
Categories
All
|
