|
Recently, I assigned a GIS problem set to my students and had them geocode addresses to obtain latitude and longitude coordinates using mqgeocode in Stata. The reason I had them use mqgeocode and not geocode3 is because the latter is no longer available through ssc. Does anybody know why? Somebody please tell me. What's the difference between the two? One difference between the two is that mqgeocode uses MapQuest API and geocode3 uses Google Geocoding API.
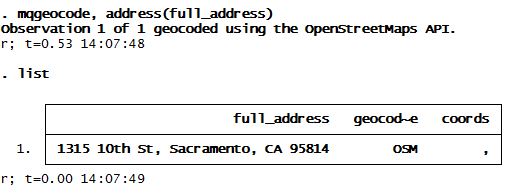
Anyway, after my students downloaded mqgeocode, I received several emails from students letting me know that they could not obtain coordinates no matter what format the addresses were in. See below:
What? No coords? Why not? With the help of the nice people over at www.wmatsuoka.com we dug a little deeper and saw that the API key in that program had probably hit its limit which is why it wasn't returning any coordinates.
A quick fix for that is to replace the two lines in that ado file with your personal API key. How do you get a MapQuest API key? Just sign up for one here. It's pretty quick and fairly easy. Then look for the lines "local osm_url1 =" and put in your own API key. I put in my API key in a local called `apikey' which was passed on to the following lines in that program. The following two lines correspond to lines 47 and 141 of the mqgeocode.ado file, respectively:
local osm_url1 = "http://open.mapquestapi.com/geocoding/v1/reverse?key=`apikey'&location="

local osm_url1 = "http://open.mapquestapi.com/geocoding/v1/address?key=`apikey'&location="
I renamed that ado file and program as mqgeo2 and quickly got to geocoding:
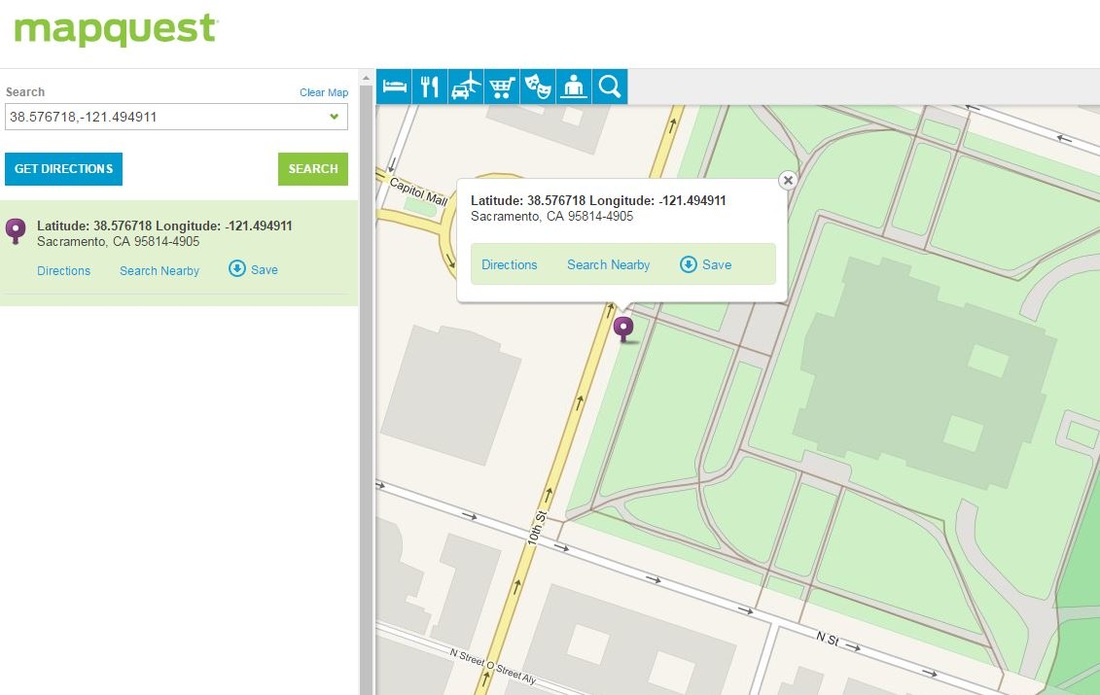
And voilà! We now have latitude and longitude coordinates for our address which happens to be the California State Capitol building.
Ta da! This is what (old) MapQuest looks like (I miss Google already)
2 Comments
Let's get local. I'm talking about San Diego beer. This is the third post regarding data I've downloaded and cleaned from BreweryDB. For a while now, I've been wanting to map all the breweries in San Diego County. Why? Well, for starters, San Diego is a great place for craft beer enthusiasts and I keep hearing about how many breweries there are in SD County. Secondly, why not? If you've got the data, use it. So now with BreweryDB and their brewery information, I can finally do that. See the map I made below. Note, however, that this map doesn't include ALL breweries in SD County. The data from BreweryDB that I downloaded is only for breweries that had at least one "verified" beer entry in their database. Also, I only included unique breweries, leaving out tasting rooms or additional brewery locations. This left me with 76 breweries which have been mapped below:
This visualization was made with Stata and Google Charts API using the links to brewery icons from BreweryDB. Any breweries without icons are shown with default red markers.
Of the available beers in BreweryDB for these 76 SD County breweries, the make-up of beer styles is as follows:
It's a pretty good variety of beer and it's great if you love Pale Ales, IPAs or Double IPAs as those seem to be the most common types of beers brewed in SD (within the North American Origin Ales category).
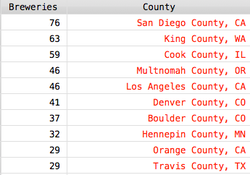
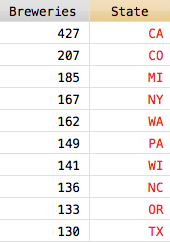
Using Stata's gpsbound command, the 2010 Census county shape files, and the latitude and longitude brewery information within the BreweryDB dataset, I summed up the number of breweries in each county and each state.
*This only includes breweries from BreweryDB that had at least one verified beer entry in the database.
California ranks first in terms of unique breweries among states and San Diego County ranks first among the counties from this dataset. San Diego is a pretty great place if you like craft beer (and even if you don't, San Diego is a pretty likable place with perfect weather). The breweries here make all kinds of beers and most tasting rooms are dog and family friendly. Go check one out if you're around. Some of my favorite SD County breweries are:
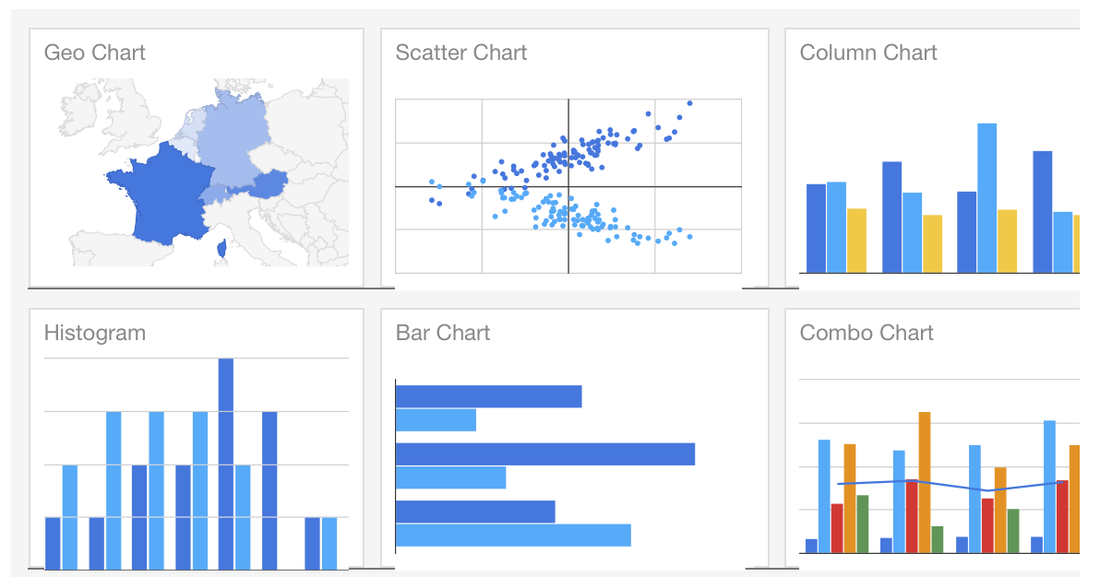
Not long ago, I was introduced to Google Charts. Ever since, I've been obsessed. I now love using Stata and combining it with Google Charts. Step 1: Clean data using Stata, Step 2: present data using Google Charts. Result: Easy to read and aesthetically pleasing visualizations for my website. Perfect.
Last month, I scraped Hayek's instagram data and made a paw-some map from the extracted latitude/longitude pairs using Google Charts and an .ado file that I came across thanks to Will, written by a former coworker of his called gmapmark which writes an .html file that creates a Google map. See said map in my dog blog: http://www.belenchavez.com/hayek/dog-friendly-sd
I decided to improve that program by incorporating the ability to have different markers for the data points by using web addresses that point to .png, .gif or .jpg images (like I did for the paw prints above). I've also added the ability to name your data points, instead of simply showing the latitude/longitude information. I've called that program gcmap short for Google Charts map. For more on making map visualizations check out Google Charts.
Example 1:
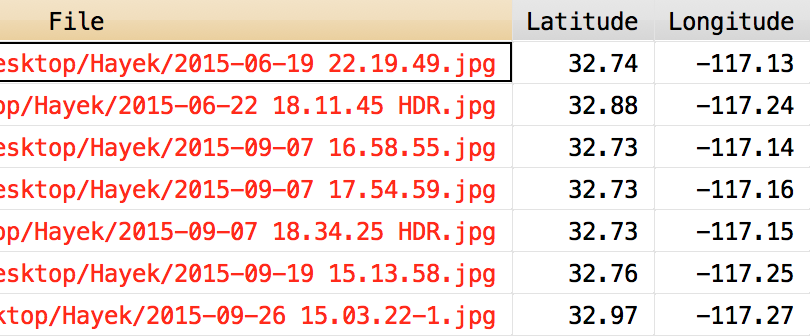
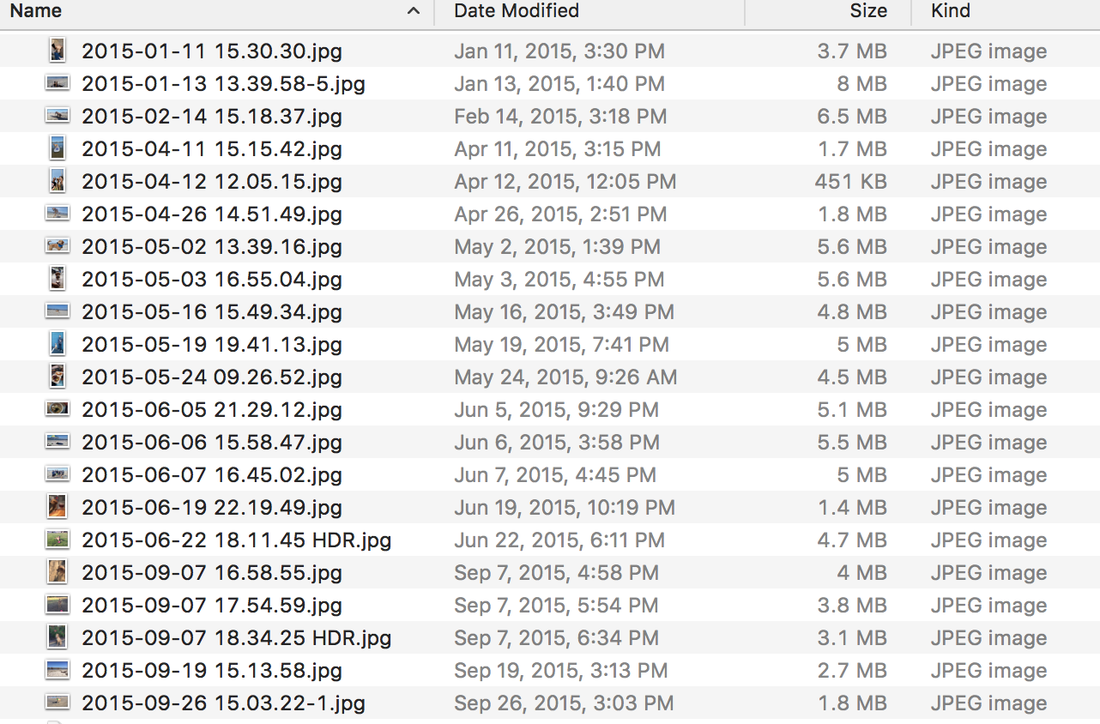
Do you own an iPhone? Do you use Photos? While I do use the Photos app on my phone, I don't like it on my computer, so I keep a separate folder of uploaded pictures that Photos doesn't touch. Back to the point, one of the features that Photos has is the ability to make a map of your pictures if your pictures have location information. Did you know that we can also make such a map using Stata and Google maps? You didn't? Well, now you know :) Let's say I want to make a Google map from several pictures I have in a folder called Hayek. How do I do that? Well first, I will extract the latitude and longitude information using exiflatlon that I have thanks to Will's post on exif information. clear version 12.1 cd Hayek exiflatlon, dir() clear * Exclude files missing lat/long data drop in 1/14
This makes the following dataset with latitude and latitude information from exif data in the pictures contained in the following folder:
I type the following into Stata after downloading gcmap and placing it in my personal ado folder. In the following example, I want the name() of the data points to be the file names from above contained in the variable "File". The option nor() contains the web location of the icon to display for the data points, which is short for normark(). The sel() option contains the web location of the icon I want to use for once a data point is selected on the map, it's short for selmark().
gcmap using "hayek_paws.html", latitude(Lat) longitude(Lon) name(File) ///
        zoom(11) ///
        nor(http://www.belenchavez.com/uploads/5/6/9/3/56930511/9243470_orig.png) ///
        sel(http://www.belenchavez.com/uploads/5/6/9/3/56930511/5261019_orig.png) ///
        replace
Which makes the following map:
Note: I could have left the nor() and the sel() options empty and this would have made a map with the usual red balloon marker points. See example below.
Example 2: I can also make a Google map from the Google location history data I have for a couple of days back in October and use the time stamp as the name for each point. Here, I don't specify nor() or sel(), so the default map markers show up. gcmap using "trip.html", lat(latitudeE7) long(longitudeE7) name(tstamp)
And there you have it! Now you too can use gcmap to make cool Google maps using Stata. Easy, right?
|
AuthorMy name is Belen, I like to play with data using Stata during work hours and in my free time. I like blogging about my Fitbit, Stata, and random musings. Archives
March 2018
Categories
All
|
||||||||||||
