|
If you have a Fitbit Charge HR, have you ever tried looking at your historical heart rate data through Fitbit's App or Dashboard? Unfortunately, you can only see 30 days worth of data, and that's about it (see picture below). Which I think is weird considering you can see your historical step data from day 1.
If you're curious like me and want to retrieve your historical resting heart rate using Fitbit's API, then this blog post is for you! 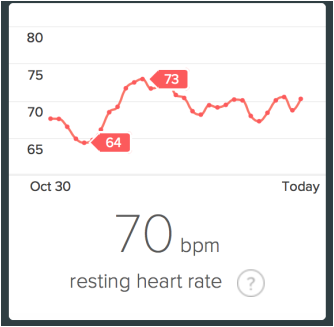
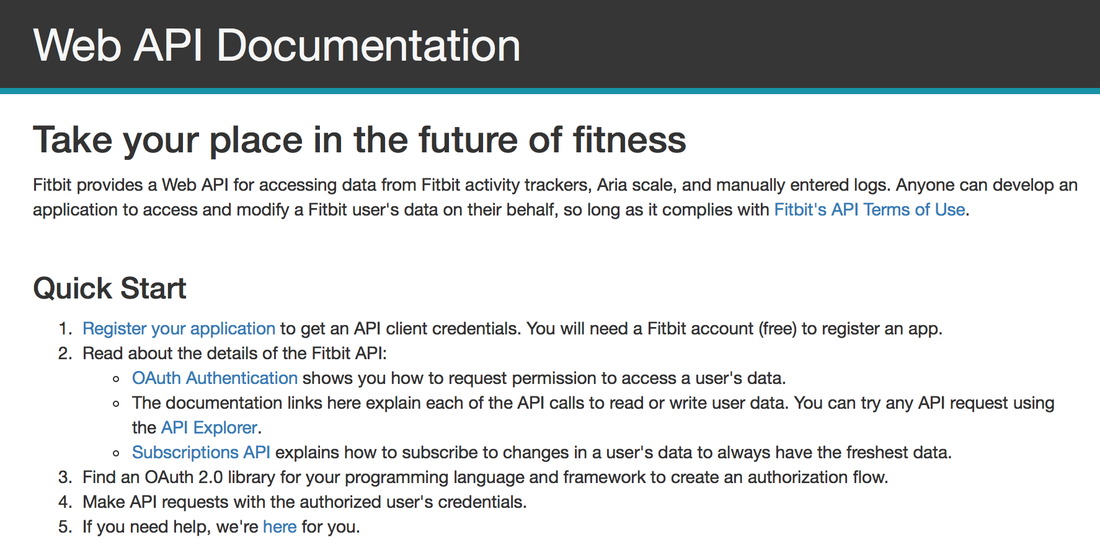
I have a registered app through Fibit Developer API and I use Fitbit's API explorer to download my own data. For steps on using Fitbit's API go to www.dev.fitbit.com/docs. The steps for the API are also below:
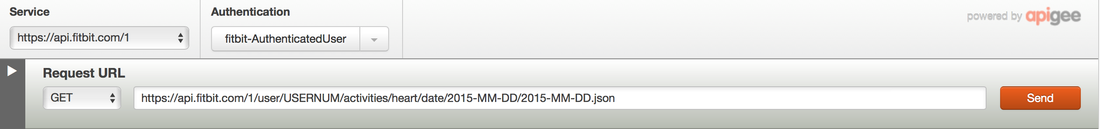
Skipping to step 2, I use the Fitbit API Explorer to get my heart rate information by typing the following request URL and replacing the USERNUM with my user number, and replacing the to- and from- dates.
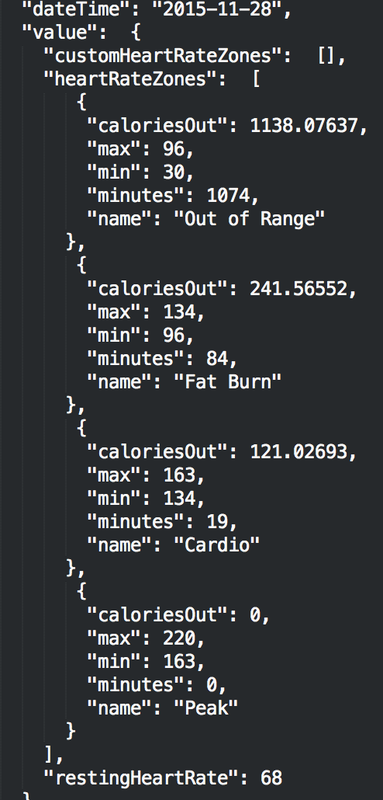
The resulting response is in JSON format which I then parse using Stata. The screenshot below shows the JSON file for yesterday's heart rate information. Unfortunately, the output doesn't contain continuous heart rate information, but it does tell me calories burned in each of the rate zones, as well as the resting heart rate for each day. Just curious, does anyone know where I can get continuous heart rate information?
The file is parsed using the following code, keeping only the date and resting heart rate:
/* Author: Belen Chavez */
/* Parse daily heart data from Fitbit JSON file */

clear
version 12.1
global fname "bc_heart.txt"

forv i = 1/7{
        tempfile f`i'
}

filefilter $fname `f1', f("{") t("")
filefilter `f1' `f2', f("},") t("")
filefilter `f2' `f3', f("[") t("")
filefilter `f3' `f4', f("],") t("")
filefilter `f4' `f5', f(",\n") t(",")
filefilter `f5' `f6', f("}") t("")
filefilter `f6' `f7', f(":") t(",")

insheet using `f7', clear delimit(",")
keep if v1=="dateTime" | v1=="restingHeartRate"
drop v3-v10

gen date = date(v2,"YMD") if v1=="dateTime"
gen resting = v2 if date==.
replace resting = resting[_n+1] if resting==""
keep if date!=.
destring resting, replace
format date %td
The graph below shows the historical resting heart rate that Fitbit has on me ever since I got my Charge HR:
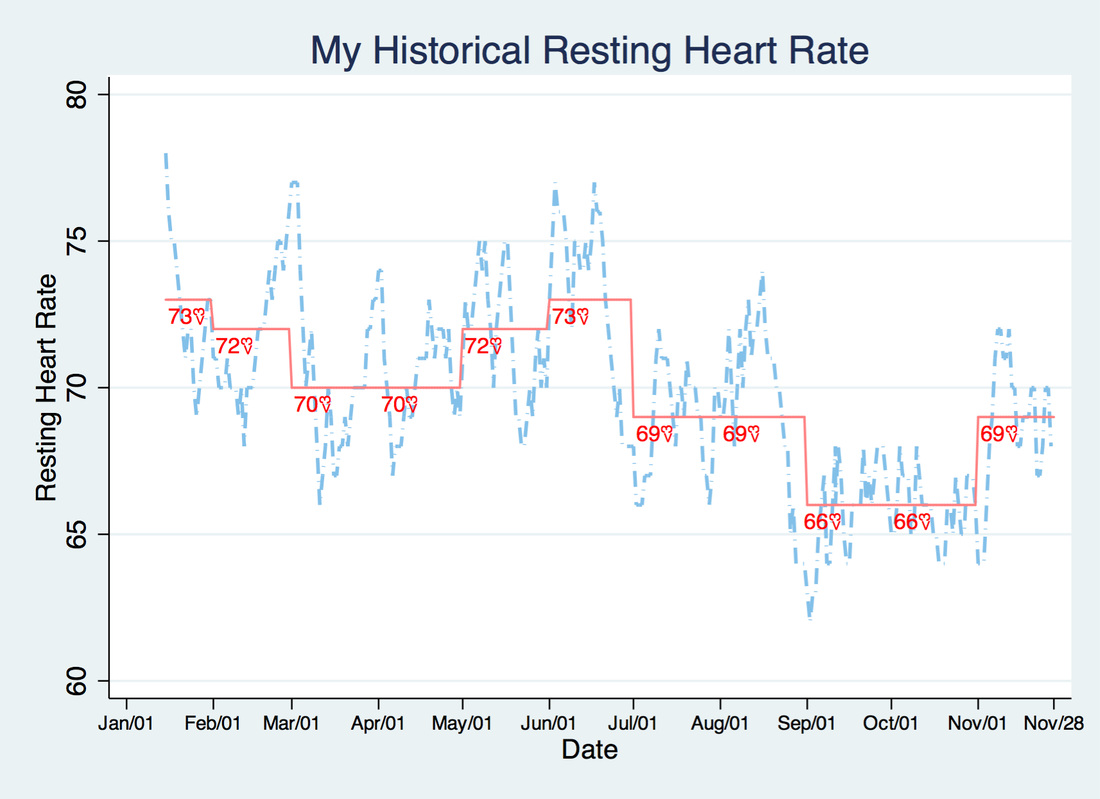
The dashed line represents my daily resting heart rate (beats per minute), the pink solid line represents my monthly average resting heart rate and the red numbers with the "<3" symbols detail what the monthly average is.
Interestingly, my resting heart rate is quite variable and seems cyclical, with the lowest range in September and October. Does anyone else's heart rate look like this? I read up on this and apparently resting heart rates vary due to medications, illness, fitness levels, and stress. In a few weeks I'll be going on vacation and taking some time off work, I'm expecting my resting heart rate to go down when I'm not at the office, but, we'll see what happens. Also, in a couple of months, I will have had my Charge HR for a year, and I also look forward to looking at the year-on-year change. I'll post more on that in late January or early February! Update April 20- Here's the code I used to make the graph above:
gen ym = mofd(Date)
egen avg_resting = mean(resting), by(ym)
format avg %6.0f
format Date %tdMon/DD
tostring avg_resting, gen(avg_str) usedisplayformat force
gen hearts = "<3"

 * Create a mid-month variable to place the markers
gen midmo = Date if day(Date)==15
 * Create a shifted mid-month variable for the heart markers
gen midmo1 = midmo+4

twoway (line resting Date, ///
        lcolor(eltblue) lpattern(dash_dot) lwidth(medthick)) ///
        (line avg_resting Date, lcolor(red*.40)) ///
        (scatter avg_resting mid,  ///
        msymb(none) mlab(avg_str) mlabcolor(red) mlabposition(6))  ///
        (scatter avg_resting midmo1, ///
        msymb(none) mlab(hearts) mlabcolor(red) mlabposition(6) mlabgap(2) ///
        mlabangle(90) mlabsize(*.75)), xlabel(#12, labsize(*.70)) legend(off)  ///
        title("My Historial Resting Heart Rate")
4 Comments
As you recall, I was without my Fitbit for a few days in early October due to someone taking it. I've compared Will's daily steps to my daily steps for the month of October in the graph below: 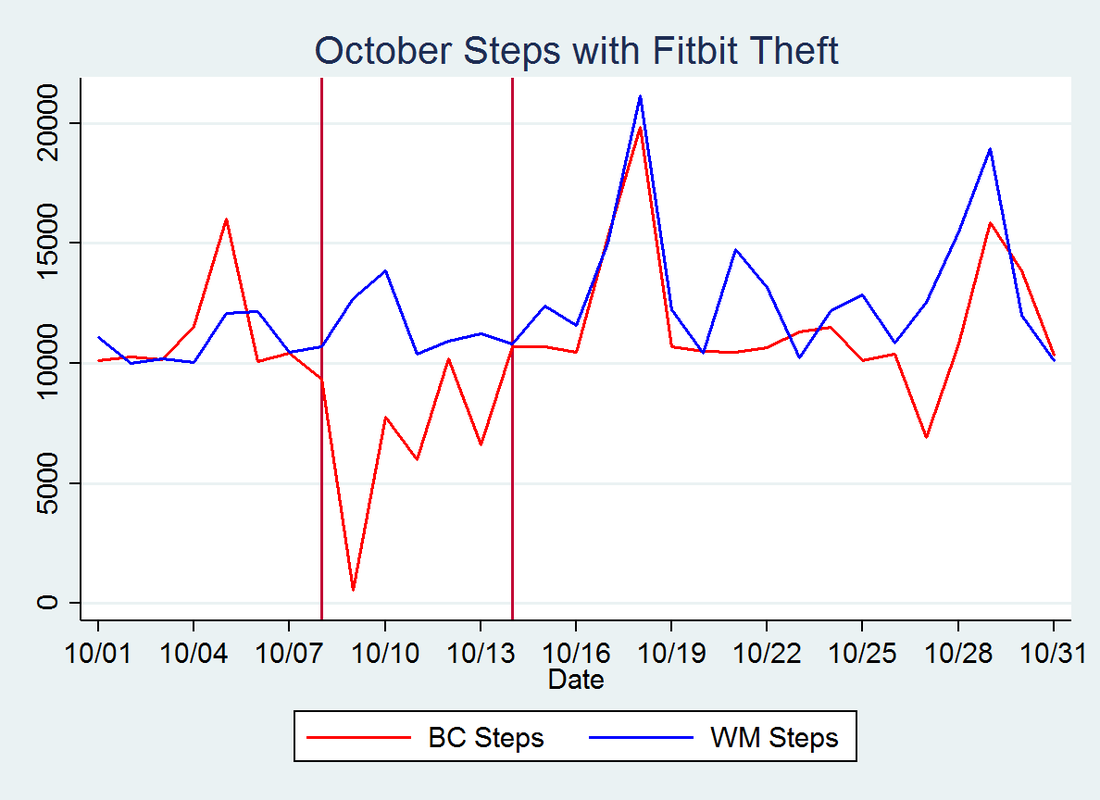 The vertical red lines show the time period that I was without my Fitbit and the few days after where I was told I was being a baby by refusing to wear it (but it smelled like someone else's perfume!). That time span was a total of about 6 days. Interestingly, Will's step count decreased while I was without my Fitbit. After I got it back and started getting back to my usual schedule, both of our step counts increased. My motivation suffered as a result of losing my month-long streak that I had pre-Fitbit theft, and Will's motivation seems to have declined as a result of my lack of motivation, too. Altogether, our steps were less correlated in October than they have been in any other month even after accounting for the theft time period. Having experienced this drop in steps, I wanted to see what our step counts have looked like in the last few months. See Thanksgiving-theme step graphs below. The colors go from yellow to brown to reflect changing leave colors in Autumn. The scatter points are our total daily steps and the horizontal lines reflect the monthly averages. 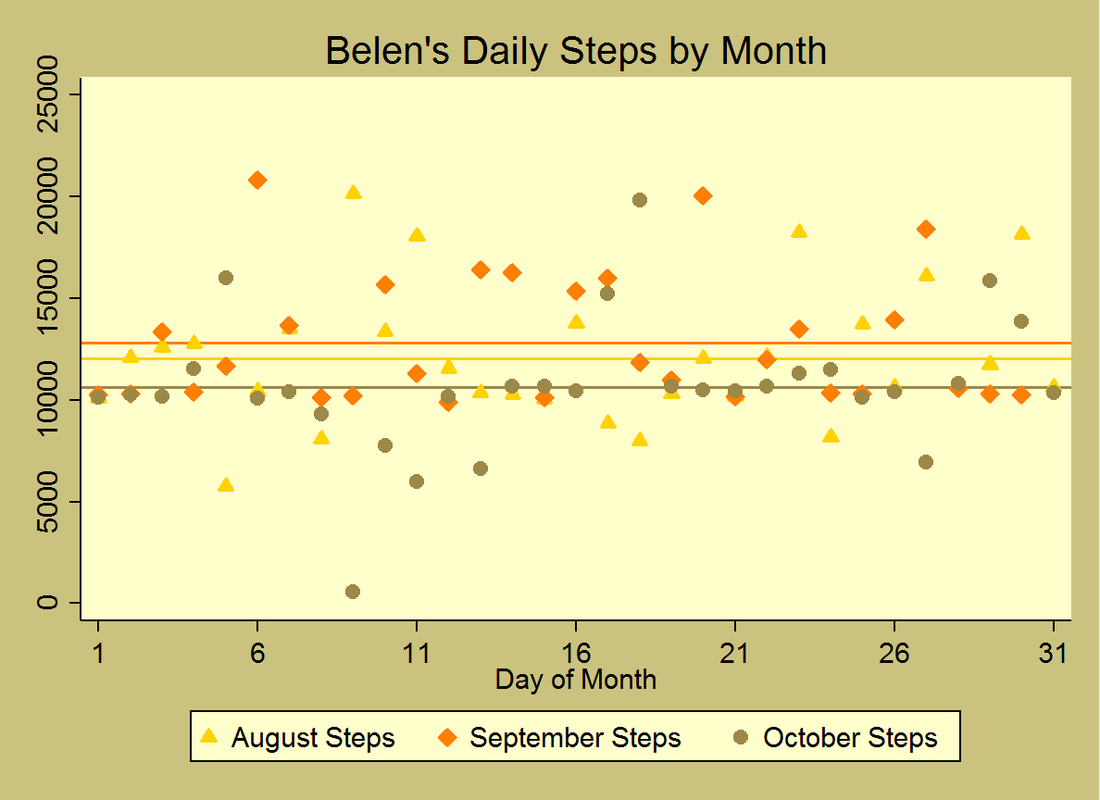 As you can see, our step counts have decreased in the last few months. While my step count increased slightly in September, October's step count was lower than both August's and September's step counts. Will's step count decreased monthly from August to October. His total step count decreased by 10.9% from August to September, and decreased 4.5% from September to October. 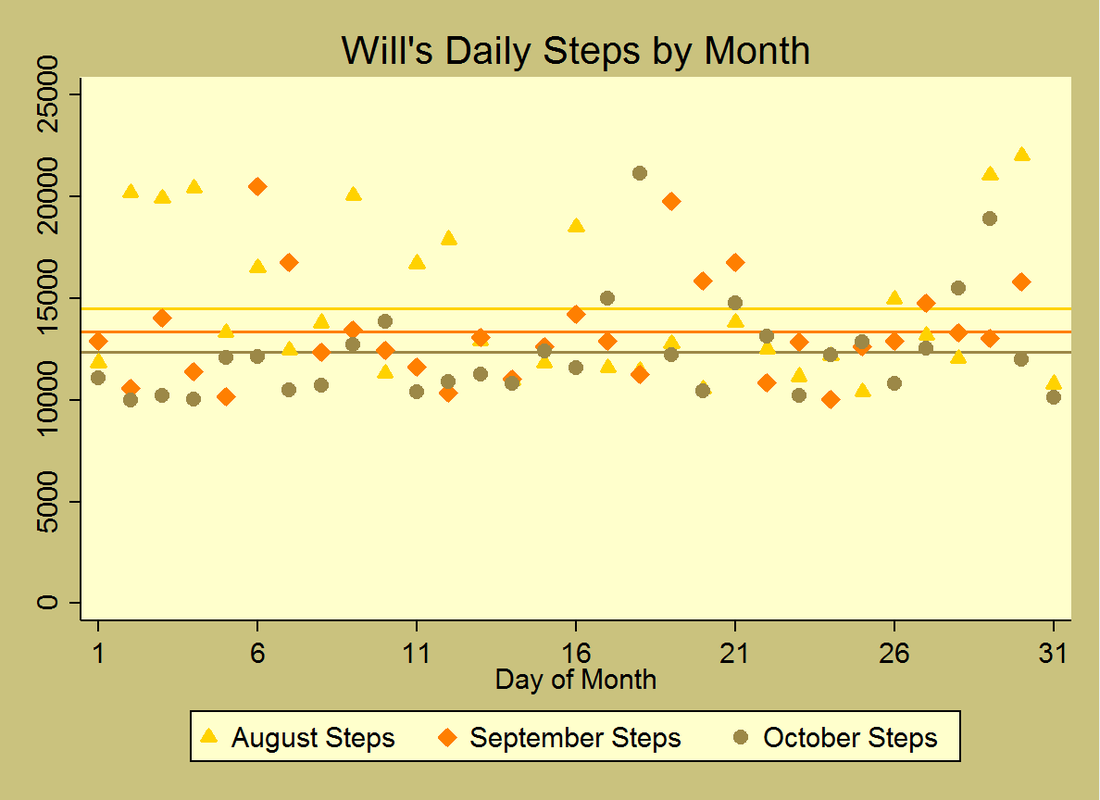 I've kept track of my November steps and made it a point to not go below my goal of 10,00 steps a day! Stay turned for November's Fitbit update coming in the next week or so.
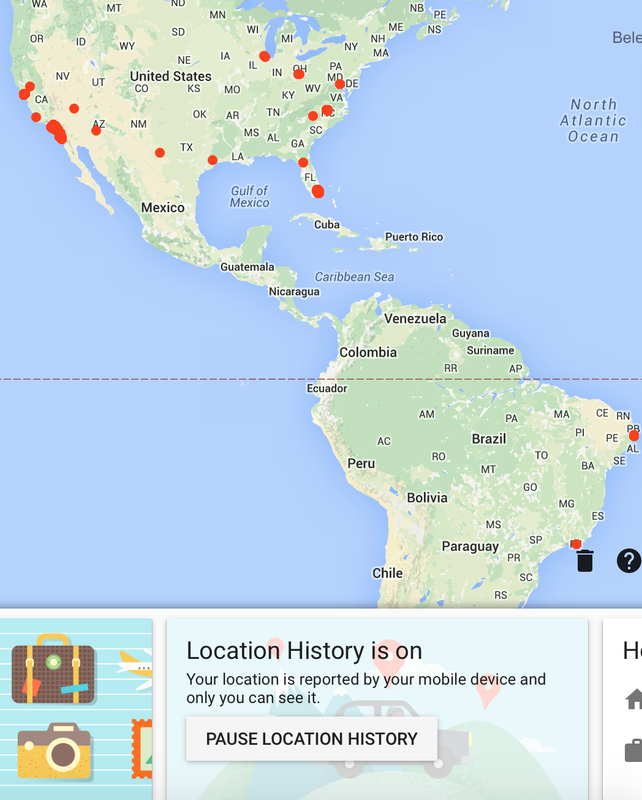
I am an avid Google user. I think (most) of their products are great. I love Google Maps, Calendar, Drive, etc. I used to share my location through Google Latitude. With Latitude, you could ping your friends and they could share their location with you. That product has been retired for a couple of years now, but thanks to that and never turning off my GPS sharing to Google on my smart phone, I have an extensive record of my location through Google.
I don't know why I never turned it off (curiosity, perhaps), but in case you don't know, Google Location History can be turned on/off depending on your preferences (see screenshot above). If you use Google and are signed in, the link to your location history (timeline) is here: https://www.google.com/maps/timeline I am not quite sure what Google is doing with my location data, but I do like how accessible/transparent it is to download my own data. My friend tried downloading his location data from Apple and was unsuccessful. I also like the fact that I could tell Google to stop collecting location data or I could even erase my location history (see screenshot below). To be honest though, I'm not sure if they'd keep a copy of it on their end (would they delete my historical data permanently?) Being the data fan that I am, I opt for both parties having the location data. Not sure why, but I trust you, Google. 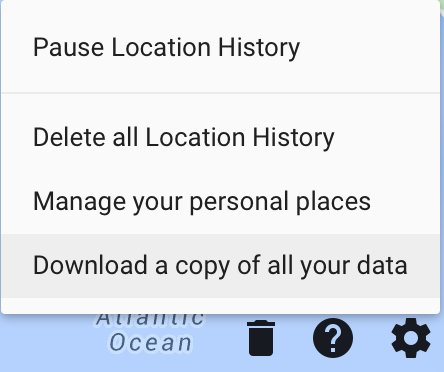
On to the data post: On November 5th, I decided to download a copy of all my location data. The location history came in a zipped JSON file with about 7.3 million rows which included data on latitude, longitude, time, accuracy, velocity, heading, altitude, and vertical accuracy. I'm not sure what those last 5 variables are, so I ignored them. I parsed the JSON file using Stata and kept one latitude and longitude set per timestamp, leaving me with 765,250 rows of data. The earliest observation is from December of 2010! That's almost 5 years worth of data.
I mapped my Google location points that were within the contiguous United States using Stata below. As expected, it looks very similar to the map above that Google gives me in my timeline, and includes points where I'm traveling. As you can see, I drove from Florida to California once, and many times to/from Southern California and Northern California. 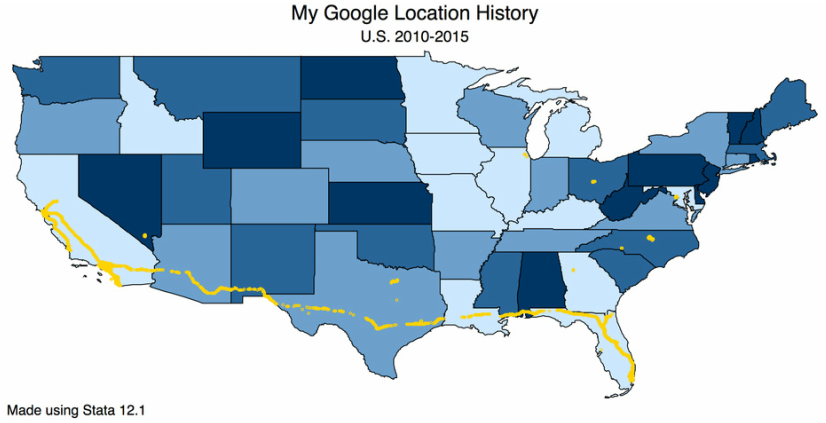
What interests me most is to see the time stamps that go along with all the location data. From this data, one could deduce:
You get the picture. With all this, Google can make suggestions and say:
Well, it never did tell me the last one, but the first two suggestions were definitely made. If Google were to create or purchase an activity tracker such as Fitbit, it would certainly know when you're sleeping (given that you have a Charge HR). How well you sleep. When you take a walk or a run, do you take your phone? I mean, the possibilities are endless. Google would know absolutely everything. Email: what you write/what you buy. Search Engine: What you search for/what you think/talk about. Calendar: what you do. Maps: where you're at. Fitness tracker: how active you are. Downloading my location history was a blast to the past and I plan on seeing what else I uncover. I'll keep you posted on any additional discoveries I have on my own data. I've included the Stata code I used below:
/**************************************************************************
Author: Belen Chavez
Purpose: Parse JSON file and clean Google Location data
***************************************************************************/
clear
version 14.1
cd "c:\users\bchavez\desktop"

global fname LocationHistory.json

tempfile f1 f2 f3
filefilter $fname `f1', f("}, {") t("\n")
filefilter `f1' `f2', f(",\n") t(",")
filefilter `f2' `f3', f(\n\n) t(\n)

import delimited `f3', delimiter(",")
drop in 1/2
forv i = 1/8{
        replace v`i' = trim(v`i')
}
drop if v1==""
keep if  regexm(v1,"timestamp")==1
keep if  regexm(v2,"lat")
assert regexm(v3,"lon")
drop v4-v8

forv i = 1/3{
        replace v`i' = subinstr(v`i', `"""', "", .)
        local name = substr(v`i', 1, strpos(v`i', " :")-1)
        cap ren v`i' `name'
        replace `name' = subinstr(`name', "`name' :","",.)
}
destring *, replace
replace latit = latit/10000000
replace longi = longi/10000000
replace times = (clock("1970", "Y")-clock("1960", "Y"))+times-8*60*60*1000
format times %tc
One of the things that I love about Stata is its ability to simplify my life. Seriously. For example, I sometimes work on big Excel spreadsheets that are full of links to other tabs and/or other worksheets. These links to other sheets can be tedious to update as a simple "drag and drop" approach doesn't translate to correct cells being referenced. While I could use Excel Macros to update these spreadsheets with correct cell references and links, I always opt for using Stata's handy putexcel function.
Suppose I know that I'll be referencing a group of cells from different worksheets and that I need to perform certain calculations containing those references. In this example, I'll show you how to do just that. In the code below, I use putexcel to update a file already created called Comparison.xlsx. I know that this final worksheet needs to be updated starting at row 3, so I set my local i = 3. From there it goes through all different files within my global directory that end in ".xlsm" using a loop. Note that I told Stata to modify my excel file. I could have chosen a replace or a sheet replace option, if I needed to, too. It then goes through the files in that directory using the local `m' which trims the ".xlsm" out of the filename in order to reference other Excel files (.xlsx) that have the same name and contain information I need. Notice all the cool things I did with putexcel: I referenced different files, different tabs, performed calculations on cell references (divided and summed across), made totals, and created a percent difference. Not only that, but I also formatted to a number displaying 2 decimal points format, number format with the 'thousands' comma separator, and percent with no decimals, for example. Not shown here, but I also format colors, borders, and cell alignment using putexcel to create nice tables and presentable spreadsheets that others in the company use. Like magic, I run this do file and it updates all numbers I need, formats it with correct number formatting, makes it look pretty and all without needing to use Excel directly. I open up the excel file I edited, Comparison.xlsx, and I replace all "=" with "=" and automatically all links become live. I hope you enjoyed this post. For more putexcel examples--especially if you like mata, take a look at Will's post.
clear all
set more off
version 14.0

global rdir "c:\users\bchavez\desktop\"
global sdir "c:\users\bchavez\wp\summaries\"

putexcel set "\${rdir}Comparisons.xlsx", sheet("All_Years") modify

local i = 3 //Beginning of Excel file inputs

local m = ""
local s = " "
local files: dir "${rdir}" files "*.xlsm"
foreach f of local files{
        local fs = subinstr("`f'", ".xlsm","",.)
        local m  "`m'`s'`fs'"
}

foreach scenario in `m'{
        putexcel B`i' = ("='\${sdir}[`scenario'.xlsx]Results'!L288") ///
                A`i' = ("`scenario'") ///
                C`i' = ("='${sdir}[`scenario'.xlsx]Results'!L287") ///
                D`i' = ("='${rdir}[`scenario'.xlsm]Pivot Tables'!L234") ///
                T`i' = ("='${sdir}[`scenario'.xlsx]Results'!O45/1000000") ///
                V`i' = ("=SUM(D`i':S`i')") ///
                X`i' = ("=SUM('${rdir}[`scenario'.xlsm]Pivot Tables'!C3224:K3224)") ///
                AA`i' = ("=SUM(Z`i',M`i')") ///
                AH`i' = ("=(Y`i'-X`i')/X`i'") ///
                B`i':C`i' = nformat(number_d2) ///
                D`i':F`i' = nformat(number_sep) ///
                T`i':U`i' = nformat(accountcur) ///
                AH`i':AP`i' = nformat(percent)
        local ++i
}

tokenize `m'
local name = "`1'"

putexcel A2 = ("Scenarios:") ///
        B1 = ("Summary")   ///
        B2 = ("Cost Ratio") ///
        C2 = ("Implied Payback") ///
        D2 = ("Forecasted X")
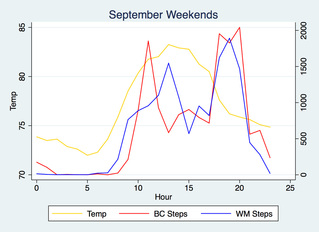
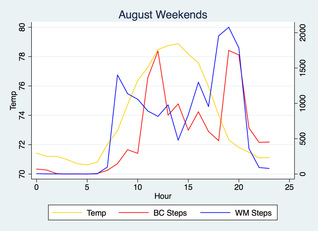
You know how when you have nothing in particular to talk about, you start talking about the weather? Well, let's talk about the weather. September was a really hot month. Well, at least in San Diego. The average temperature recorded at Miramar (KNKX) was 76.3 with a minimum of 66 and a maximum of 94. Compare this to a mean of 73.7, a minimum of 60 and a maximum of 90 in August. For this blog post I wanted to see how my steps looked like alongside the average hourly weather for September. Above, you'll see the hourly weather (in yellow) compared to my average hourly steps (in red) alongside my coworker Will's hourly steps (in blue). During the weekends in September I was more active as the day progressed and the weather got cooler. I took a few long runs or walks in August and September during Saturday/Sunday mornings which explains the spikes before noon. Overall, however, there was less activity during the hotter parts of the day in September than in August, which is to be expected. Nobody wants to be out running when it's hot and humid. Not a lot of surprising data, but it's nice to visualize it here. 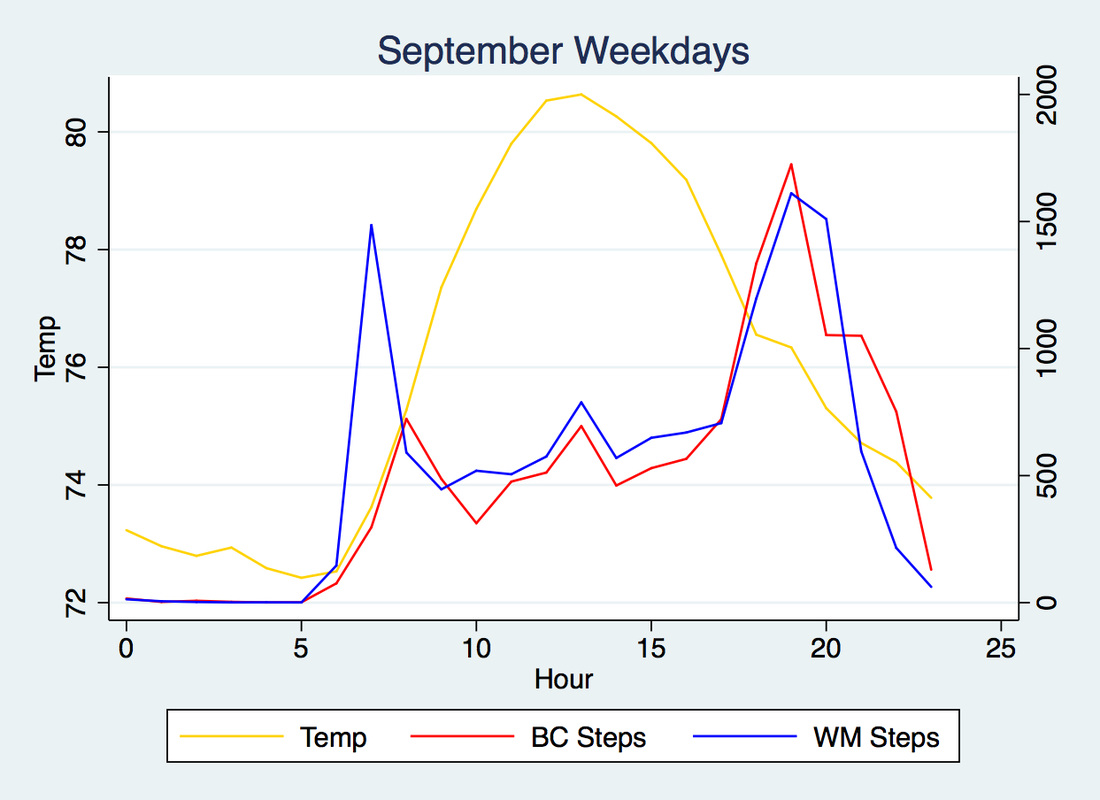 During weekdays, I'm at the office and so there's not a lot of step activity while I'm at work. Recall last month's post regarding my hourly step comparison with my coworker Will. Our steps during the work hours (8 AM - 6 PM) is correlated at 0.93 (our weekend steps were a little correlated at 0.85) in the month of September. A bit higher than last month's 0.89.
I'd be interested to see how correlated my steps are with other people who have a Fitbit at the office, but I have a suspicion it's probably the same as ours. Walks happen during the earlier part of the day, during lunch time, and then going back to the car after work. Thankfully, I didn't suffer too much during last month's heat wave as I was at the office during those hours. Stay tuned for next month's monthly comparison. My plan is to see how Fitbit challenges, like the Weekend Warrior, look on an hourly basis. I hypothesize there are many lags as competitors are driven to beat each other's steps.
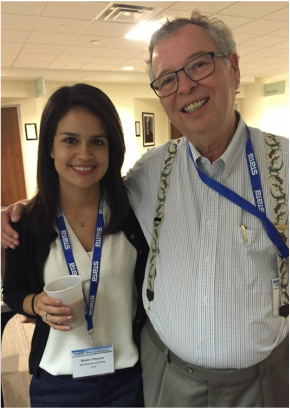
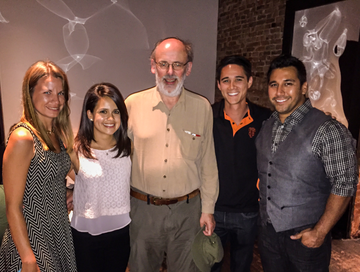
In late July, I got to attend Stata's conference in Columbus, Ohio. It was my first Stata Conference and I went as part of my professional development through my employer. Three of my coworkers also went to the conference and we got to meet fellow Stata users, Stata programmers, Stata employees, and best of all: Bill Gould & Nick Cox!
Day 1: My very first interaction while checking in to the conference was having Stata's Twitter and social media manager recognize that I tweet a lot about Stata. My day was off to a great start! I liked all the different presentations on various different fields and got to learn about Stata commands that I didn't even know existed. At the end of day 1, there was a dinner that most conference attendees went to, and we, for some reason, did not purchase dinner tickets. Big mistake. However, thanks to Stata's awesome hosts we got invited to partake on the dinner fun and it was the best decision ever. We got to sit at the table with Bill Gould, Richard Williams (he has a great website), and Phil Ender (a former consultant at UCLA.) We also got to mingle with friendly Stata employees like Chris and Gretchen, who were the ones making sure the conference was going smoothly and who graciously invited us to dinner. Our networking with Phil was such a success that we were able to get a great seminar on missing data in San Diego last month. Day 2: A continuation of very informative presentations. For example, did you know that there are a bunch of different color schemes available for charts and graphs (brewscheme)? Or did you know that you can use -display- to save locals? You can see an example of that on my post regarding parsing fitbit data: local da: di %tdDay_Mon_dd,_CCYY dofc(r(min))
Overall a great experience! I highly recommend it. Not only did I learn a lot, but I also had a lot of fun. One of my favorite memories was discussing Stata's untapped market of Stata themed bed linens & pillow-cases with Nick Cox and my coworkers. This idea came up after asking Gretchen if they sold the Stata tablecloth (pictured below) in the Stata gift shop. They don't. We all said it would be nice to hug a Stata pillow at night (nerds, but hey I love it!)
I took the picture below while departing Chicago en route to Columbus, little did I know that this is where #Stata2016 will be held. Until next year, Stata Conference!

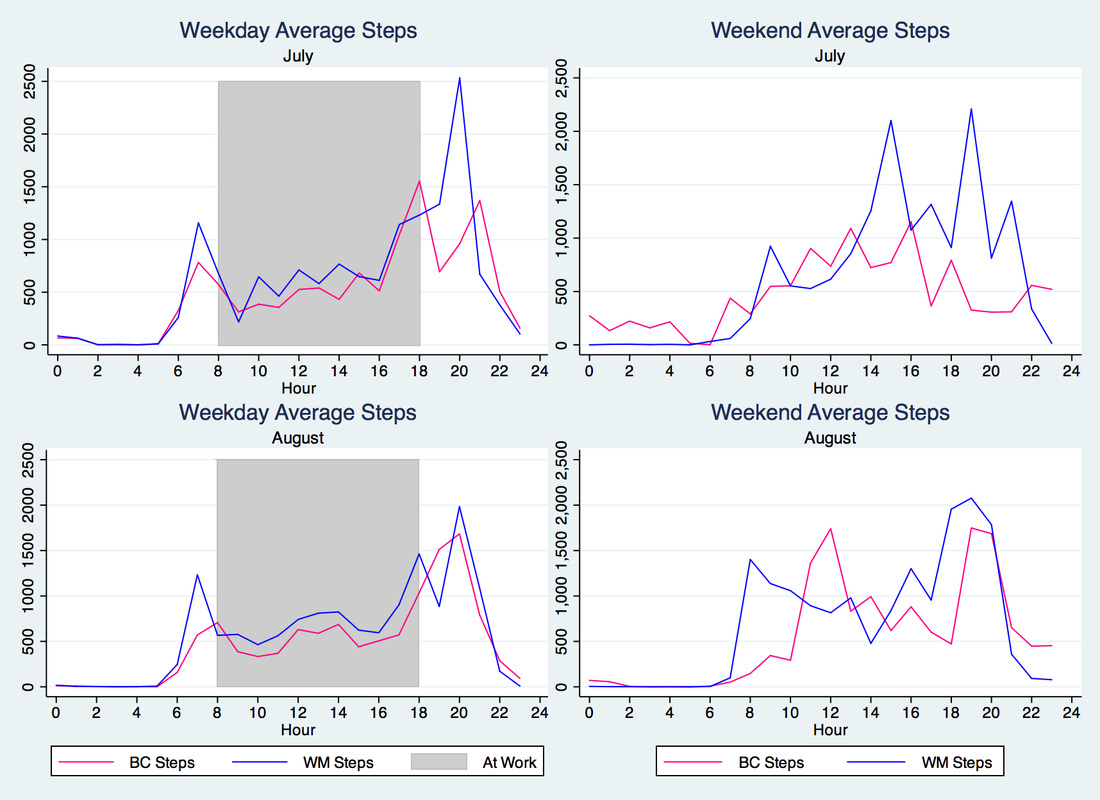 A fellow coworker of mine gave me his hourly Fitbit steps data to analyze in combination with my data to see if there are any similarities or patterns that emerge. Above, I've summarized the average steps taken hourly for both of us by weekday or weekend for the months of July and August. Note: He purchased his Fitbit in July, so there are a few days that are missing, but he more than made up for that by logging crazy amounts of steps (he got to 25,000 steps in one day -- a Fitbit "badge" I've yet to earn!). So, what does this data tell us? During weekdays of July and August:
So why did I do this? Well, at work, the both of us constantly check our Fitbits and compare whose got the most steps. It kind of drives everyone who doesn't have a Fitbit a little insane (and maybe even those who have Fitbits, but aren't obsessed). Friendly, and better yet, healthy rivalries never hurt anybody, right? For more details, I've included a snapshot below of the last full week of August. You can see we have very similar weekdays and sometimes I'm even winning in terms of step count :) 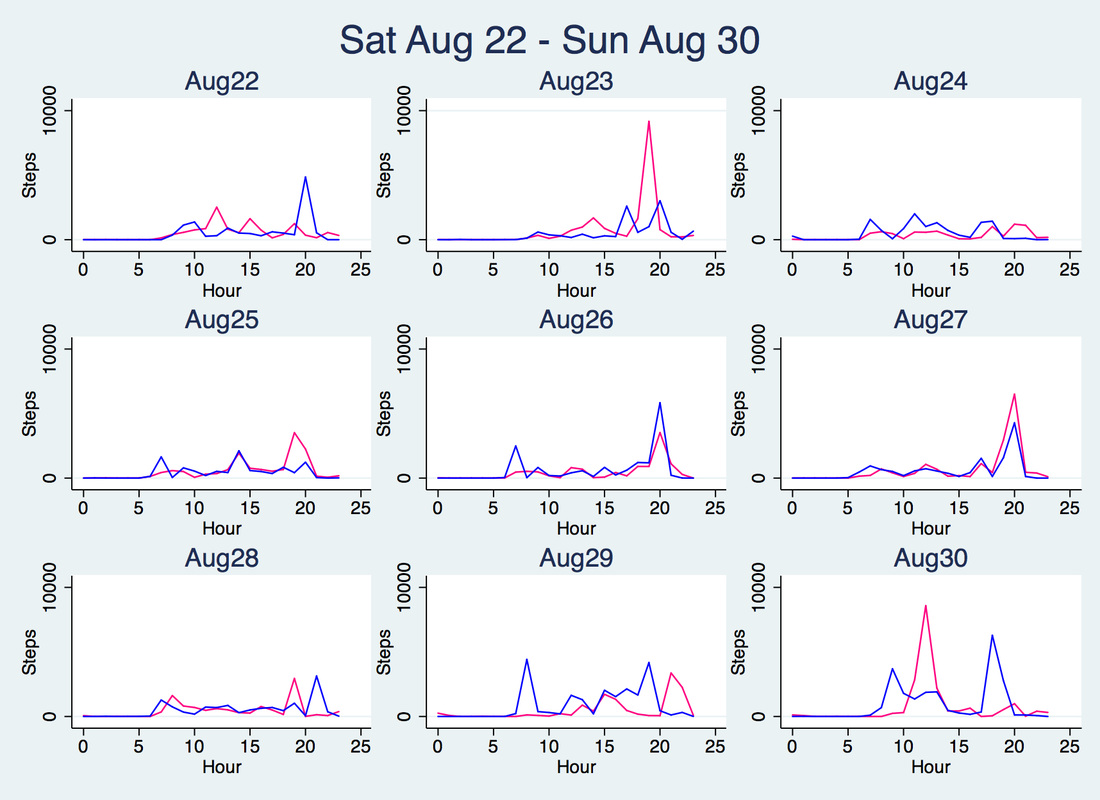 Hoping that my September step count looks a lot better than WM's or my previous month's step count, for that matter. It better be! I just signed up for my first half marathon!
Thanks to my Fitbit Charge HR, I have been tracking my activities, such as running, walking, and Barre3. Logged activities on Fitbit include a summary of calories burned, minutes spent in different heart rate zones, total time of activity, and steps taken. I wanted to see if different instructors were having a different effect on my workouts since I sometimes left a hot mess and other times not so much after leaving Barre3. So, I started tracking activities and have a total of 94 classes in a sample that I've analyzed to figure out which instructors pushed me the most. Below, I’ve plotted the average number of minutes spent in each heart rate zone from fat burn, cardio, to peak zone along with my instructors .
Not only did this visualization help me figure out which instructors were pushing me the most it also helped me realize that I was spending less than 15 minutes in the cardio zone (on average) doing the online workouts! I guess the class atmosphere is more effective (plus, sometimes Hayek would interrupt my workouts - he really likes my yoga mat). As you can see, Jenn, Kate and Lauren helped me spend more time in the peak heart rate zone, so their classes were the ones I liked to attend the most. I originally made a dashboard on Tableau by downloading my activity data on Fitbit, cleaning up the data using Stata, saving it as a .CSV file and then playing with different visualizations on Tableau Public. I originally also posted the Tableau chart here, however, when displaying it on my blog it didn't seem to be mobile friendly so I used Google Charts API instead. It ended up being a win-win: I learned something new and now mobile readers will have an easier time scrolling through the chart. 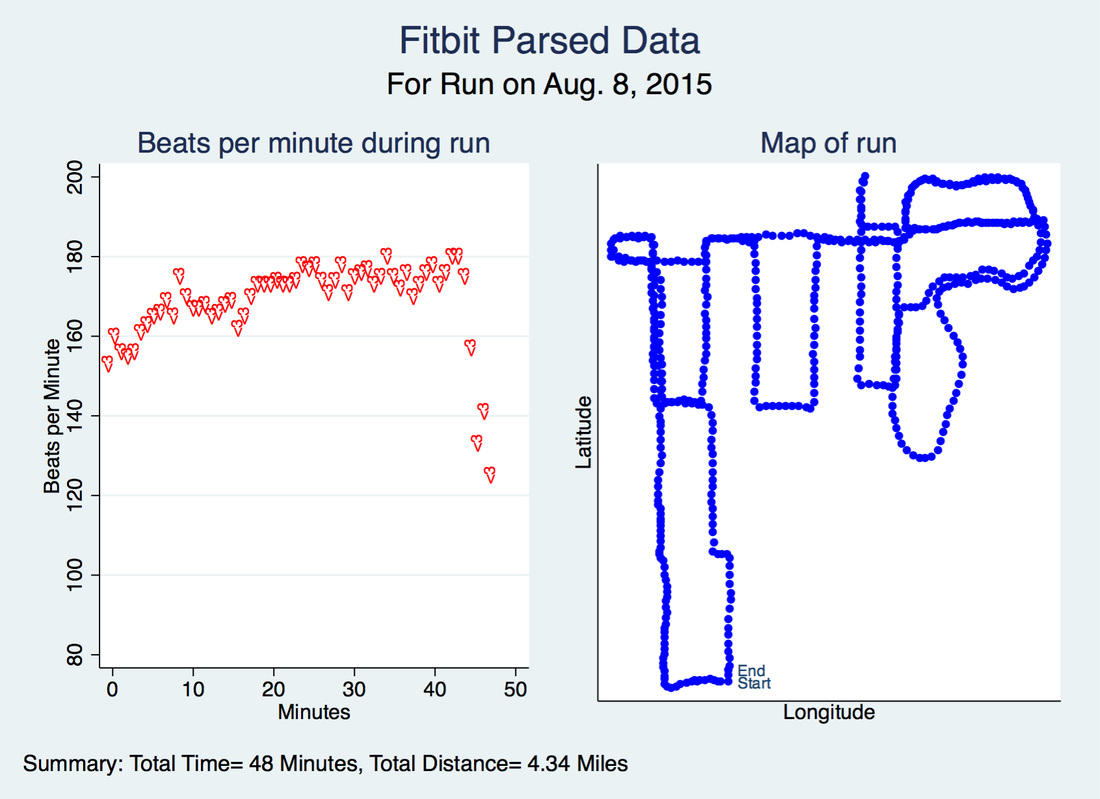
My data is from Fitbit.com. Graphs were made using Stata 12/IC.
Recently, I learned how to parse data on Fitbit.com by going to the Log -> Activities page and looking at individual activities such as walks or runs in Stata. By viewing the page source information and saving it as an .html file, I am able to parse out what data my fitbit collects during an activity such as: duration, calories burned, distance, latitude, longitude, heart rate zones, heartbeat, pace, and speed.
Above, I've graphed my heart rate along with the map of last Saturday's run using GPS coordinates. The hearts (<3) represent my heart rate, which I thought was a really creative way of using the mlab option in the -scatter- command. Who says you're limited to circles, diamonds, squares or triangles in Stata? I made the heart symbols by using a variable I set to "<3". The mlab option also helped me make the "Start" and "End" markers in the map plot. In the next week or so, I plan on using Fitbit's API to make more use of my personal data. Stay tuned :) If you'd like to try this out, copy and paste this into your do-file editor. Make sure to change the global name of the file (fname) to the name of your html file and make sure you're in that directory when running this .do file. As always, feel free to reach out if you have any questions, suggestions, or comments!
/*Author: Belen Chavez*/
/* Description: Parse .HTML code of GPS activity from Fitbit.com to bring into
Stata and create graphs */
clear all
version 12.1
global fname "runactivity2.html"
tempfile f1
/*************** Remove double quotes and some html formatting ****************/
filefilter $fname `f1', f("\Q") t("")
tokenize </span> </td> </tr> <tr> > td class=line-number ///
<td class=line-content> <span class=html-tag> ///
<span class=html-attribute-value> class=html-attribute-name> ///
< <br> -07:00
local i = 1
local j = 2
tempfile f2 f30 f31 f32 f33 f34 f35
while "`1'" != ""{
filefilter `f`i'' `f`j'', f("`1'") t("") replace
mac shift
local ++i
local ++j
tempfile f`j'
}
filefilter `f`i'' `f`j'', f("<<") t("<")
filefilter `f`j'' `f31', f(",{date") t("\n{date")
filefilter `f31' `f32', f("}]") t("}\n")
filefilter `f32' `f33', f("},{") t("}\n{")
filefilter `f33' `f34', f(\n\n) t(\n) replace
filefilter `f34' `f35', f(",{paused") t("\n{paused")
replace v1 = itrim(v1)
replace v1 = subinstr(v1,"<<","<",.)
keep if regexm(v1,"{date:")
/* Drop empty variables*/
replace v1 = subinstr(v1,"trackpoints: [","",.)
qui desc
forv i = 1/`r(k)'{
cap assert v`i'==""
if _rc==0{
drop v`i'
}
}
/* Rename variables */
compress
forv j = 1/15{
replace v`j' = subinstr(v`j',"{","",.)
local nname "`=substr(v`j'[1],1,strpos(v`j'[1],":")-1)'"
di "`nname'"
replace v`j' = subinstr(v`j', "`nname':","",.)
ren v`j' `=proper("`nname'")'
destring `=proper("`nname'")', ignore("{""null" ) replace
}
gen Heartzone = real(substr(v23,-1,1))+1 if regexm(v23,"BELOW")!=1
replace Heartzone = 1 if regexm(v23,"BELOW")==1
move Heartzone Heartrate
/* Drop unnecessary variables */
qui desc
local vr = `r(k)'-1
drop v16 - v`vr'
/* Format time variable */
replace Date = subinstr(Date,"`=substr(Date,-6,6)'","",.)
replace Date = subinstr(Date,"T"," ",.)
gen time = Clock(Date,"YMD hms")
format time %tC
move time Date
drop Date
replace Dur = Dur/60/1000
* Replace missing Heartzone values:
ren Heartrate Heartbeat
forv j = 1/4{
cap qui summ Heartbeat if Heartzone==`j'
cap replace Heartzone = `j' if Heartzone ==. & Heartbeat>=`r(min)' & Heartbeat<=`r(max)'
}
* Label variables
la def m 1 "No-Zone" 2 "Fat Burn" 3 "Cardio" 4 "Peak", replace
la val Heartzone m
la var Heartbeat "Beats per Minute"
la var Heartzone "Heart Rate Zone"
la var Cal "Calories Burned"
la var Speed "Miles per Hour"
la var Pace "Seconds per Mile"
la var Elev "Feet"
la var Dis "Miles"
la var Dur "Minutes"
la var Lat "Latitude"
la var Long "Longitude"
la var Steps "Steps"
gen lab = "<3"
gen tick = "Start" in 1
replace tick = "End" in l
gen every_10 = 1 if mod(_n,10)==1
summ Dis
local Dis: di %4.2fc `r(max)'
di `Dis'
summ Dur
local tim: di %2.0fc `r(max)'
di `tim'
summ time
local da: di %tdDay_Mon_dd,_CCYY dofc(`r(min)')
twoway (scatter Heartbeat Dur if every_10==1 ,ylab(80(20)200) ///
mlab(lab) msymb(none) mlabcolor(red) mlabangle(vertical) ///
mlabpos(12)) , ///
tit("Beats per minute during run") name(minutes, replace)
scatter Lat Long, mlab(tick) msymb(smcircle) tit("Map of run") ///
lpattern(dash) mcolor(blue) ///
xlab(none) ylab(none) name(maps, replace)
graph combine minutes maps, ///
title(Fitbit Parsed Data) subtitle("For Run on `da'") ///
note("Summary: Total Time= `tim' Minutes, Total Distance= `Dis' Miles")
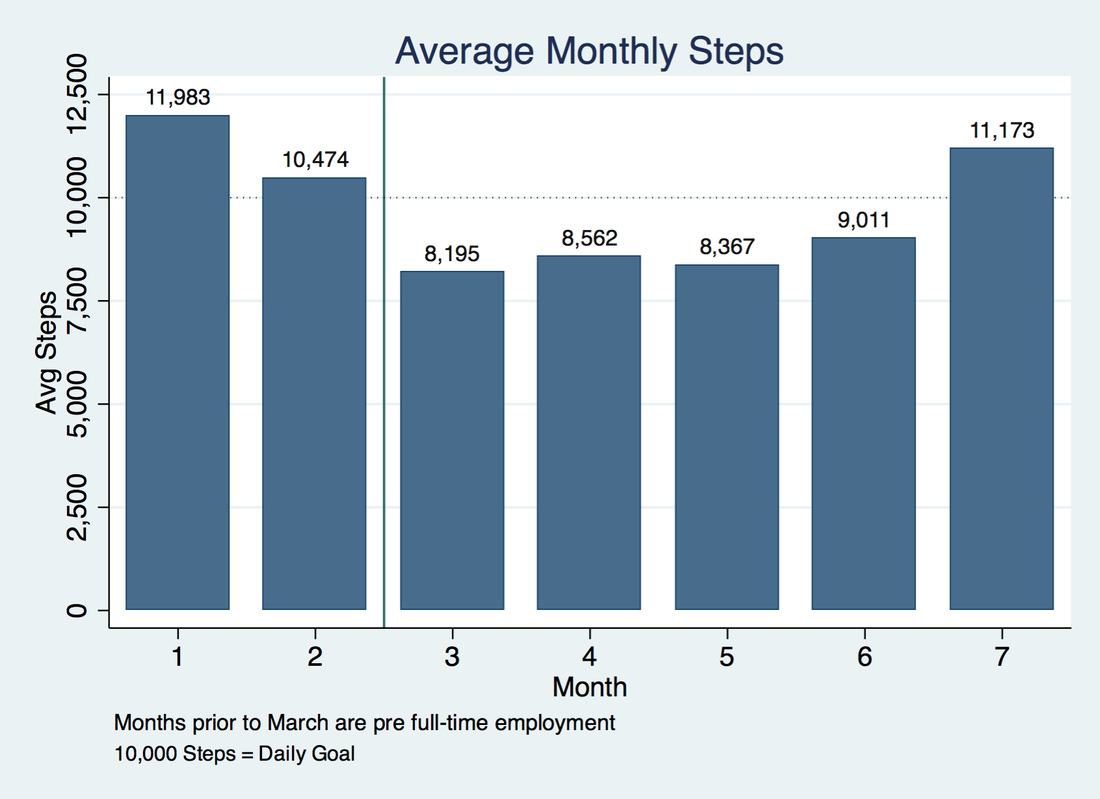 This graph was made using Stata 12. Data was downloaded from my Fitbit.com dashboard. Recently a few of my coworkers purchased Fitbits and we've been having friendly competitions to see who can get the most steps. I know, it kind of sounds lame, but not surprisingly, I've found that I'm exceeding my steps goal on a daily basis since they bought theirs. Here's a snapshot of my Fitbit App's average steps taken on a monthly basis.
January and February were months where I was super motivated to meet my step goal, which was probably driven by my New Year resolutions and by the "new Fitbit" effect (whereby one wants to meet daily step goals to justify the Fitbit purchase). I was also unemployed in those two months and had more time to walk/run/play. In March, I started a new full-time job and became more sedentary. July is where my steps start to go up again which I like to attribute to competition. I'm generally a competitive person, so this makes sense. Plus, no one likes to lose, right? |