|
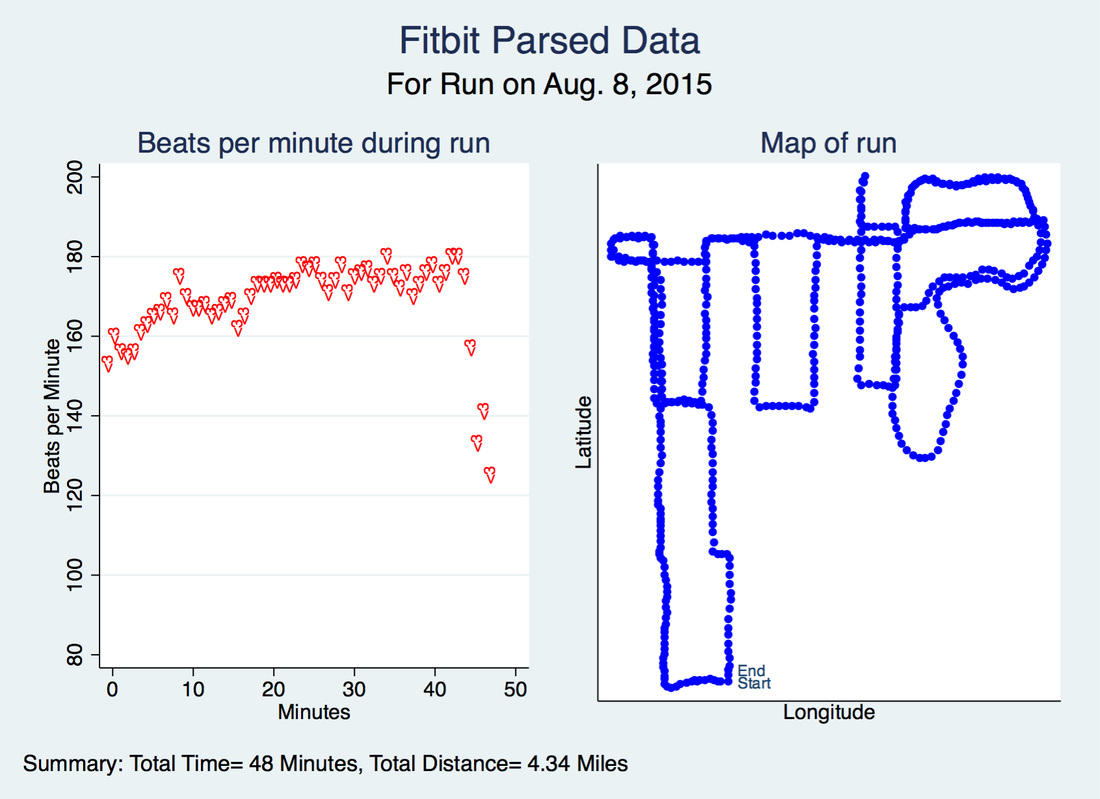
Recently, I learned how to parse data on Fitbit.com by going to the Log -> Activities page and looking at individual activities such as walks or runs in Stata. By viewing the page source information and saving it as an .html file, I am able to parse out what data my fitbit collects during an activity such as: duration, calories burned, distance, latitude, longitude, heart rate zones, heartbeat, pace, and speed.
Above, I've graphed my heart rate along with the map of last Saturday's run using GPS coordinates. The hearts (<3) represent my heart rate, which I thought was a really creative way of using the mlab option in the -scatter- command. Who says you're limited to circles, diamonds, squares or triangles in Stata? I made the heart symbols by using a variable I set to "<3". The mlab option also helped me make the "Start" and "End" markers in the map plot. In the next week or so, I plan on using Fitbit's API to make more use of my personal data. Stay tuned :) If you'd like to try this out, copy and paste this into your do-file editor. Make sure to change the global name of the file (fname) to the name of your html file and make sure you're in that directory when running this .do file. As always, feel free to reach out if you have any questions, suggestions, or comments!
/*Author: Belen Chavez*/
/* Description: Parse .HTML code of GPS activity from Fitbit.com to bring into
Stata and create graphs */
clear all
version 12.1
global fname "runactivity2.html"
tempfile f1
/*************** Remove double quotes and some html formatting ****************/
filefilter $fname `f1', f("\Q") t("")
tokenize </span> </td> </tr> <tr> > td class=line-number ///
<td class=line-content> <span class=html-tag> ///
<span class=html-attribute-value> class=html-attribute-name> ///
< <br> -07:00
local i = 1
local j = 2
tempfile f2 f30 f31 f32 f33 f34 f35
while "`1'" != ""{
filefilter `f`i'' `f`j'', f("`1'") t("") replace
mac shift
local ++i
local ++j
tempfile f`j'
}
filefilter `f`i'' `f`j'', f("<<") t("<")
filefilter `f`j'' `f31', f(",{date") t("\n{date")
filefilter `f31' `f32', f("}]") t("}\n")
filefilter `f32' `f33', f("},{") t("}\n{")
filefilter `f33' `f34', f(\n\n) t(\n) replace
filefilter `f34' `f35', f(",{paused") t("\n{paused")
replace v1 = itrim(v1)
replace v1 = subinstr(v1,"<<","<",.)
keep if regexm(v1,"{date:")
/* Drop empty variables*/
replace v1 = subinstr(v1,"trackpoints: [","",.)
qui desc
forv i = 1/`r(k)'{
cap assert v`i'==""
if _rc==0{
drop v`i'
}
}
/* Rename variables */
compress
forv j = 1/15{
replace v`j' = subinstr(v`j',"{","",.)
local nname "`=substr(v`j'[1],1,strpos(v`j'[1],":")-1)'"
di "`nname'"
replace v`j' = subinstr(v`j', "`nname':","",.)
ren v`j' `=proper("`nname'")'
destring `=proper("`nname'")', ignore("{""null" ) replace
}
gen Heartzone = real(substr(v23,-1,1))+1 if regexm(v23,"BELOW")!=1
replace Heartzone = 1 if regexm(v23,"BELOW")==1
move Heartzone Heartrate
/* Drop unnecessary variables */
qui desc
local vr = `r(k)'-1
drop v16 - v`vr'
/* Format time variable */
replace Date = subinstr(Date,"`=substr(Date,-6,6)'","",.)
replace Date = subinstr(Date,"T"," ",.)
gen time = Clock(Date,"YMD hms")
format time %tC
move time Date
drop Date
replace Dur = Dur/60/1000
* Replace missing Heartzone values:
ren Heartrate Heartbeat
forv j = 1/4{
cap qui summ Heartbeat if Heartzone==`j'
cap replace Heartzone = `j' if Heartzone ==. & Heartbeat>=`r(min)' & Heartbeat<=`r(max)'
}
* Label variables
la def m 1 "No-Zone" 2 "Fat Burn" 3 "Cardio" 4 "Peak", replace
la val Heartzone m
la var Heartbeat "Beats per Minute"
la var Heartzone "Heart Rate Zone"
la var Cal "Calories Burned"
la var Speed "Miles per Hour"
la var Pace "Seconds per Mile"
la var Elev "Feet"
la var Dis "Miles"
la var Dur "Minutes"
la var Lat "Latitude"
la var Long "Longitude"
la var Steps "Steps"
gen lab = "<3"
gen tick = "Start" in 1
replace tick = "End" in l
gen every_10 = 1 if mod(_n,10)==1
summ Dis
local Dis: di %4.2fc `r(max)'
di `Dis'
summ Dur
local tim: di %2.0fc `r(max)'
di `tim'
summ time
local da: di %tdDay_Mon_dd,_CCYY dofc(`r(min)')
twoway (scatter Heartbeat Dur if every_10==1 ,ylab(80(20)200) ///
mlab(lab) msymb(none) mlabcolor(red) mlabangle(vertical) ///
mlabpos(12)) , ///
tit("Beats per minute during run") name(minutes, replace)
scatter Lat Long, mlab(tick) msymb(smcircle) tit("Map of run") ///
lpattern(dash) mcolor(blue) ///
xlab(none) ylab(none) name(maps, replace)
graph combine minutes maps, ///
title(Fitbit Parsed Data) subtitle("For Run on `da'") ///
note("Summary: Total Time= `tim' Minutes, Total Distance= `Dis' Miles")
0 Comments
Your comment will be posted after it is approved.
Leave a Reply. |
AuthorMy name is Belen, I like to play with data using Stata during work hours and in my free time. I like blogging about my Fitbit, Stata, and random musings. Archives
March 2018
Categories
All
|

