|
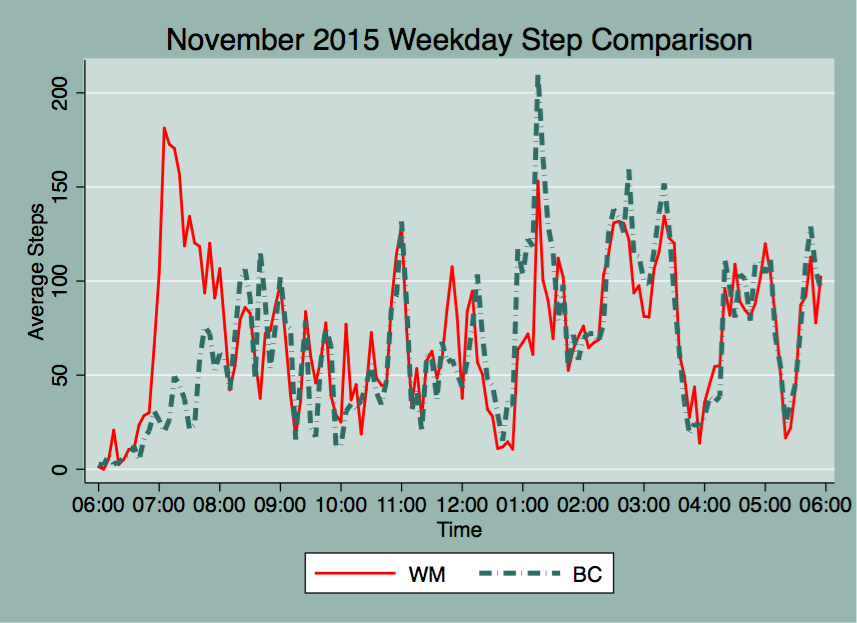
For November's Fitbit comparison, I'll be using 5-minute interval data during the workweek between the hours of 6 AM to 6 PM. I've averaged the 5-minute intervals and graphed them below. My steps are outlined in the green dashed lines and Will's are in solid red lines. Seeing as Christmas is only 6 days away (can you believe it?) I've made these graphs look more festive! As you can see, I got plenty of steps from 12:30 to 1:30, on my lunch break as I walk puppy Hayek during that time. On average, the lunch hour step activity reflect my peak steps for the workday, whereas Will's peak step count happens much earlier, around 7 AM. I usually get to work around 8-8:30 AM, and from that point onward our step correlation is approximately 0.80. After 12 PM, our step correlation is about 0.84 as we sometimes go on walks around the campus during our breaks after lunch. Below are some graphs detailing total step counts during 5-minute intervals for a few days in November: Walking breaks stand out in this graph as step counts climb pretty quickly. Also, simultaneous walk breaks are evident as the total step activity shows for November 24.
Pretty soon people will be out of the office as vacations come up and as the year winds down, present company included :) I look forward to seeing what my step count looks like while on vacation. I will keep you all posted!
0 Comments
Your comment will be posted after it is approved.
Leave a Reply. |
AuthorMy name is Belen, I like to play with data using Stata during work hours and in my free time. I like blogging about my Fitbit, Stata, and random musings. Archives
March 2018
Categories
All
|


